I was asked to look into whether there was evidence of gender bias in interview outcomes. In particular, I was asked to provide:
1. A summary report for the executive team.
2. A detailed report for the data team, covering analysis details, possible follow-up tasks, open questions, etc.
Article Summary
Domain: Statistical Auditing, People Analytics & DE&I Data Integrity
Core Objective: Evaluate gender bias in on-site interview decisions across 4,538 candidates, distinguish stage-specific pipeline bias from final selection outcomes, and uncover data pipeline anomalies.
Methodology: Confounding variable isolation (Simpson’s Paradox identification), p-value hypothesis testing for decision rates and time-to-decision, and data quality forensics (data provenance tracking via schema case-sensitivity).
Key Analytical Breakthroughs:
Simpson’s Paradox Isolation: Aggregate company data skewed male (p < 1.57 x 10⁻²¹), but department-level disaggregation revealed zero male-favorable bias at the on-site stage. Engineering exhibited a statistically significant selection bias toward female candidates (82% vs. 61%, p < 8.44 x 10⁻⁵).
Upstream Pipeline Imbalance: The overall headcount skew stems entirely from top-of-funnel interview pool composition (Engineering and Product invited men at 7.5x and 20.7x the rate of women).
Data Forensic Discovery: Identified an ingestion bug where lowercase gender tags (
"male","female") isolated a specific inbound source with a $2.7\times$ lower conversion rate (p < 0.004), alongside a 1.6-day time-to-decision penalty for women in Engineering (p < 2.37 x 10⁻⁶).
Table of Contents
The Executive Summary
Gender Bias in On-Site Interview Outcomes
Key Findings
-
No overall gender-based hiring bias was detected
-
In the Engineering department, women had a higher probability of being hired than men
-
-
More men are hired than women overall, including in Engineering, due to more men being interviewed than women
Overview
An analysis of 4538 on-site interview outcomes showed no systemic bias in hiring decisions across company departments. The Engineering team was found to be the lone standout, where women who interviewed for Engineering roles were hired at a significantly higher rate than men (82% vs 61%).
A large gender gap was observed in the actual interview pools, however, with departments like Engineering and Product inviting men to on-sites at a ratio of 15:2 and 20:1, respectively, while Marketing and Sales were interviewing more women than men. The result is that, despite equitable hiring rates from on-site interviews in most departments, the overall gender composition of new hires skews heavily male, particularly in Engineering and Product roles.
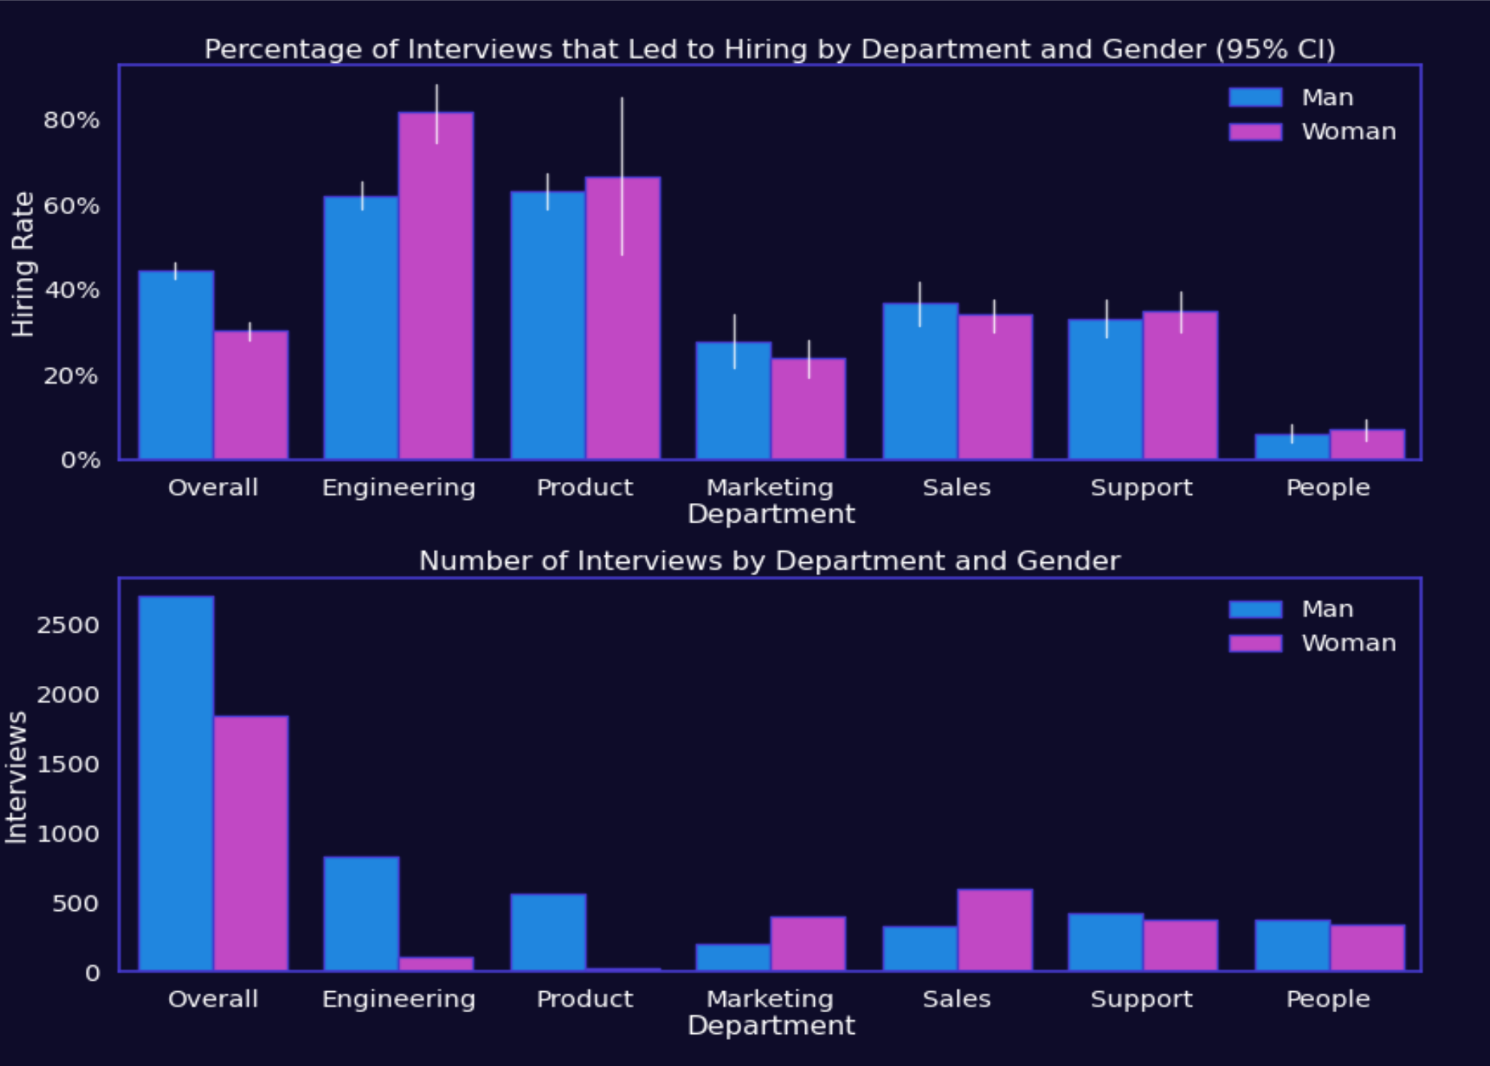
Figure 1: The probability of being hired for a role in each department, given that the applicant has had an on-site interview, broken down by gender.
The Extended Report
Gender Bias in On-Site Interview Outcomes Addendum
Key Findings
While the organization as a whole has a clear gender imbalance in its staffing, skewing towards male hires (as seen in Fig. 1; p < 1.57e-21), there is no evidence that the various departments across the organization show a bias towards hiring men out of the on-site interview phase. Five out of six departments showed no statistically significant difference in the probability of hiring a man or a woman, while the sixth – Engineering – actually seemed to show a preference for hiring women (p < 8.44e-05).
The underlying hiring imbalance, instead, comes from an imbalance in the candidate pools for different departments. More men are making to the on-site phase in departments that have more roles, while more women are being interviewed for smaller or more slowly growing departments. This is a classic example of Simpson’s Paradox.
Additional Findings
Interview Pool Composition
Several departments showed sizable imbalances in interview pools, with Engineering and Product having 7.5x and 20.7x times as many men being interviewed as women, respectively, while Marketing and Sales had 2x and 1.8x as many women being interviewed as men. This may simply reflect the number of men and women applying for roles in these departments, but it could also suggest an underlying bias in the pre-on-site stages of the recruitment pipelines for those departments.
Engineering Time-to-Decision Anomaly
Hiring rates weren’t the only area where gender discrepancies were seen in the Engineering department. The time to make a hiring decision was also significantly different between genders (Fig. 1), with decisions about women taking 1.6 days longer on average (p < 2.37e-06). This is, at least in large part, due to candidate dismissals happening significantly faster than offers (Fig. 3), but even controlling for hiring outcomes, the department still took 0.4 days longer to make decisions about women than for men (p < 0.018).
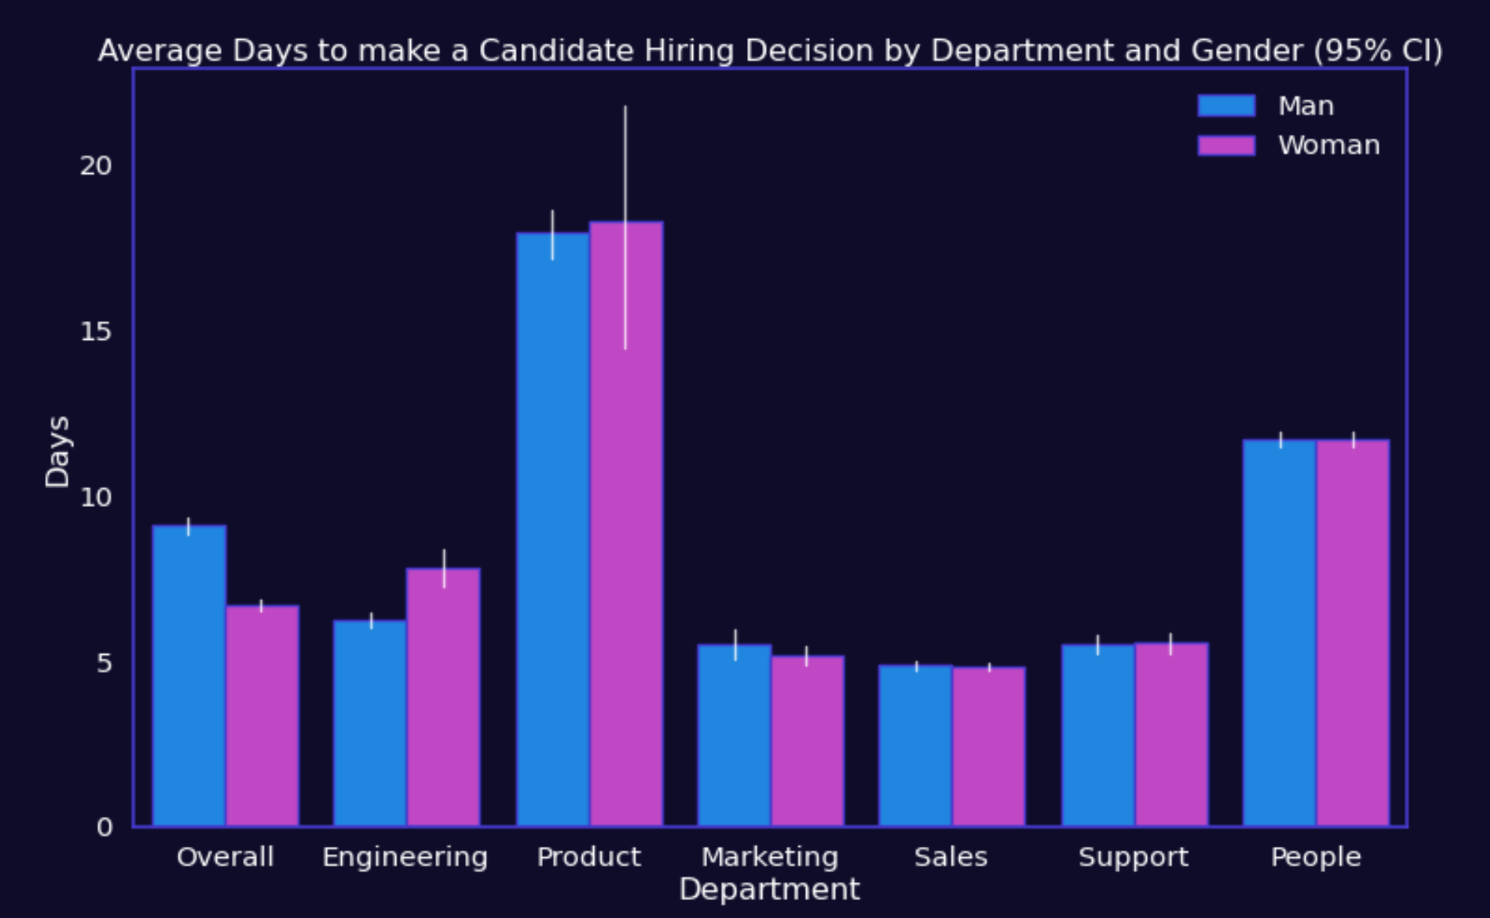
Figure 1: The average number of days, per candidate, to make a hiring decision by department and gender. A notable gender difference is seen in Engineering, while Product and People take signficantly longer to make decisions than the rest of the organization.
Inbound Application Source Anomaly
The Gender field in the raw data lists six value: “Male”, “Female”, “male”, “female”, “Did Not Participate”, and N/A. Looking only at candidates labeled with binary genders, it turned out that there was a significant difference in hiring rates between those who had capital-lettered gender labels and those who had lowercase gender labels, with upper-case applicants being 2.7x more likely to be hired (p < 0.004).
All interviewees with lowercase labels came from the “inbound” source. It’s not entirely clear why the labels were stylized differently, but possible causes include applicants coming from different job boards, or data being transcribed by different individuals. The cause for the different hiring rates is equally unclear; possible explanations include application quality, a different intake process, or differential treatment of applications from this/these source(s).
Excessive Hiring Times in Product and People
The Product department appears to be taking about three weeks to issue offers to successful candidates, which is significantly and substantially longer than most other departments in the organization (11.9 days vs 24.6 days, p ~ 0; see Fig. 3). The People team also takes significantly longer than average (16.5 days; p < 2.52e-04). This seems like it would risk losing strong candidates due to hiring indecision.
Data Quality Issues & Data Cleaning
-
Lowercase gender field values: as previously mentioned, a number of applicants from the “inbound” source had lowercase gender values. These were converted to title case.
-
Missing gender field values: several (10) applicants had missing gender data. These were lumped in with applicants who Declined to Participate (2), in an “Unknown” category. This was then excluded from analysis due to headcounts being too small to analyze.
-
Negative time-to-decision values: impossible values indicating that hiring decisions were made before interview date, likely a data entry or system error in source tooling. These rows removed.
-
Interview dates recorded in 2013: likely transcription errors (2013 vs 2023); rows removed
-
Missing department values: several candidates did not have department values (10). These rows were removed.
-
Open applications: several applicants (35) had no decision information, presumably because they were still under active consideration, so their rows were removed.
Recommendations for Further Investigation
-
Investigate the source of negative time-to-decision values in the underlying data system
-
Look further back in the hiring funnel, examining application counts and screening interviews/outcomes by gender to assess whether there is a bias further up the pipeline.
-
Audit the inbound application source associated with lowercase gender entries to determine whether application quality, intake process, or candidate treatment differs for that pool of candidates
-
Monitor the "Declined to Participate" cohort as dataset volume grows to ensure candidates are not being penalized for skepticism around fair treatment
-
Look into whether applicant data can be enriched with application scores so that we can assess whether differences in interview pools are driven by differences in applicant pools or applicant quality
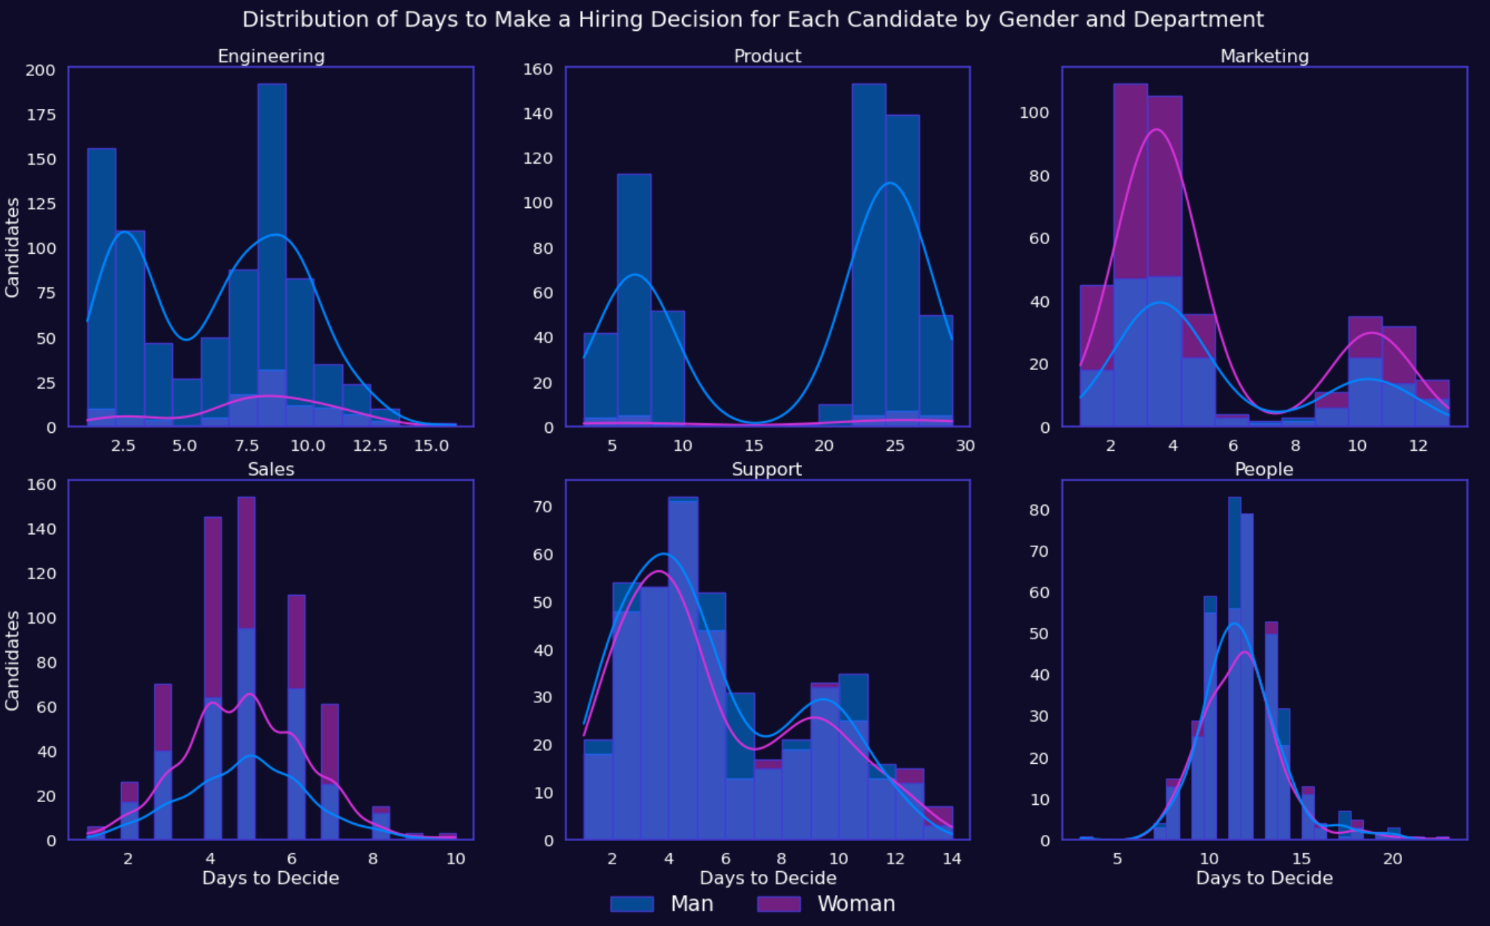
Figure 2: Distributions of time-to-decision by gender for different departments. Note how a bimodal is seen in most departments, except for Sales and People.
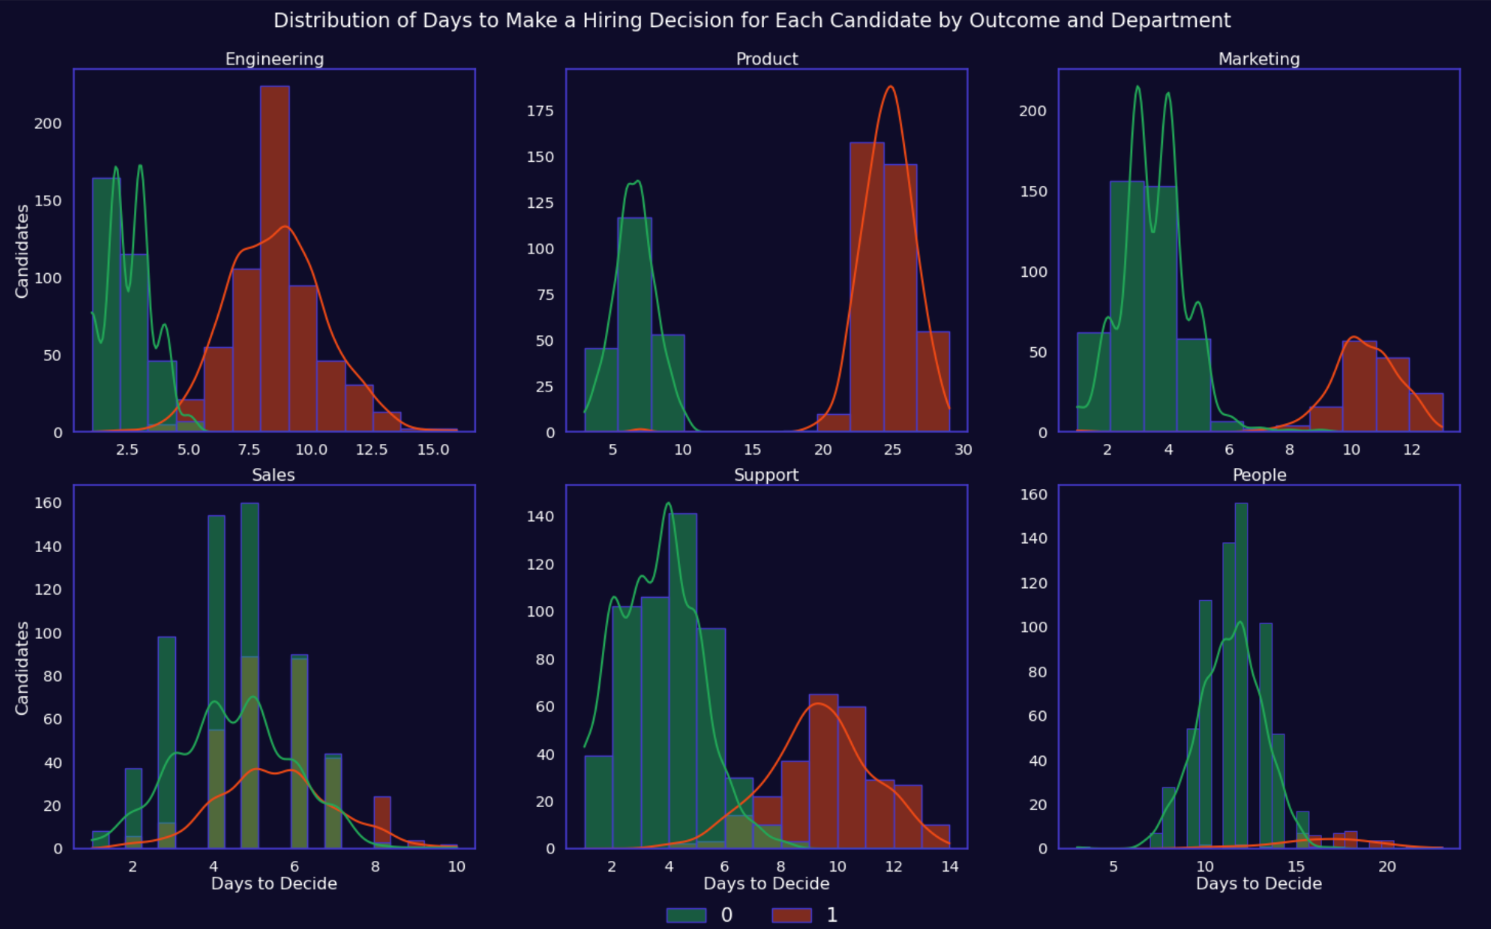
Figure 3: Distributions of time-to-decision by outcome for different departments (green: rejected, orange: hired). Here, the different distributions become more evident in the Sales and People departments.