Article Summary
Domain: Methodological Review, Data Journalism Critiques & Talent Acquisition Analytics
Core Objective: Deconstruct a flawed recruitment trends report to highlight statistical blind spots, compositional biases, and unaddressed confounding variables.
Methodology: Systematic interrogation of data definitions, identifying composition/denominator shifts, diagnosing potential Simpson's Paradox, and verifying whether conclusions directly answer the headline premise.
Key Analytical Vulnerabilities Identified:
Proportional Distortion vs. Absolute Volume: Demonstrating that a drop in the proportion of referrals (from 2% to <1%) is primarily a mathematical artifact of surging inbound volume rather than an absolute decline in referral counts.
Denominator & Stage Confusion: Uncovering ambiguity between "offer rate per applicant" vs. "offer rate per interviewee," which conceals whether conversion shifts stem from changing candidate quality or talent acquisition capacity constraints.
Confounding & Aggregation Bias: Pointing out that pooling 38M applications across heterogeneous company sizes, industries, and job levels without controlling for role distribution creates severe risk of Simpson’s Paradox.
I had been asked to provide feedback on this article. This was my response:
Who is the audience for this article? Hiring managers? Job seekers? Talent acquisition specialists?
With a massive increase in inbound application volumes
Are “inbound” applications the only ones that have increased? The linked article only discusses “business and tech” roles. Is this trend seen in other roles? How are “business” and “tech” defined?
This report analyzes over 38M applications across 93K jobs from January 2021 to December 2024.
What types of jobs? At what kind of companies? How large? Which sector? Did they have multiple positions open for the same role? Do referrals matter more in some contexts and less in other? Are different categories of roles being preferentially applied to by referrals or internal candidates? Is Simpson’s Paradox in play here?
Between the start of 2021 and end of 2024, we see an average of:
- 93.8% of applications coming from inbound
- 4.8% from sourced
- 1% from referral
- 0.4% from agency
- 0.05% from internal
How is “inbound” defined? Are there meaningful differences between different “inbound” sources? What’s the difference between a “sourced” application and an “agency” application?
Looking at referral more closely, we can see that the proportion of applications coming from referrals has been decreasing over time — from 2% in Q1 2021 to less than 1% three years later (Q1 2024). During this same time period, the proportion of applications coming from inbound increased.
Proportions are a zero-sum measure, so if one cohort increases in proportion others must decrease by definition. We know that inbound applications have increased in total counts; what do the other cohorts do? Are they increasing at a less accelerated rate? Are any of them declining, in terms of real counts? Holding steady over time?
Internal CandidatesReferred Candidates<
- 42% of internal candidates go from application to interview
- Out of internal candidates interviewed, 32% go from interview to offer
- Some internal applicants are hired without a formal interview
Agency Candidates
- 40% of referred candidates go from application to interview
- Out of referred candidates interviewed, 16% go to an offer stage
- 42% of agency candidates go from application to interview
- Out of agency candidates interviewed, 8% go from interview to offer
Have the number of screening interviews per opening performed by talent acquisition personnel changed over time? What about the number of interviews performed by hiring mangers per opening? Have the number of interviews per opening sourced from different channels changed over time, or merely the size of the applicant pools?
Why are agency offer rates so low, especially in comparison to referrals? Why aren’t agency-sourced candidates benefiting from the same “validated” status as an internal referral? Do companies that leverage hiring agencies have meaningfully different hiring processes than those that don’t? Are they offering meaningfully different roles than those that don’t?
All that said, we have seen a decrease in offer rates among all application sources except for internal applicants.
Is this offers per interviewed candidate by application source, or offers per applicant by application source? Without knowing this, and whether interviews/opening have meaningfully changed, it’s difficult as a reader to intuit what might be driving this, or whether this is meaningful information for TA teams or job seekers.
Though the absolute change is relatively small, in relative terms inbound applications experienced a ~70% reduction in offer rates (7 in 1000 to 2 in 1000), the largest decrease of any application source. This correlates with inbound volume tripling in the past few years. However, as found in our Offer Acceptance Talent Trends report, we know that inbound applicants remain the dominant source of all hires made. This finding is consistent with the general theme of more scrutiny, evaluation, and effort in vetting the inbound application source
Isn’t this what we’d expect to see if source distribution of hires remained the same, while the application pool from “inbound” tripled? If the number of interviews/opening from “inbound” remains the same, the interviews/application from “inbound” is going to drop by something in the neighbourhood of 70%.
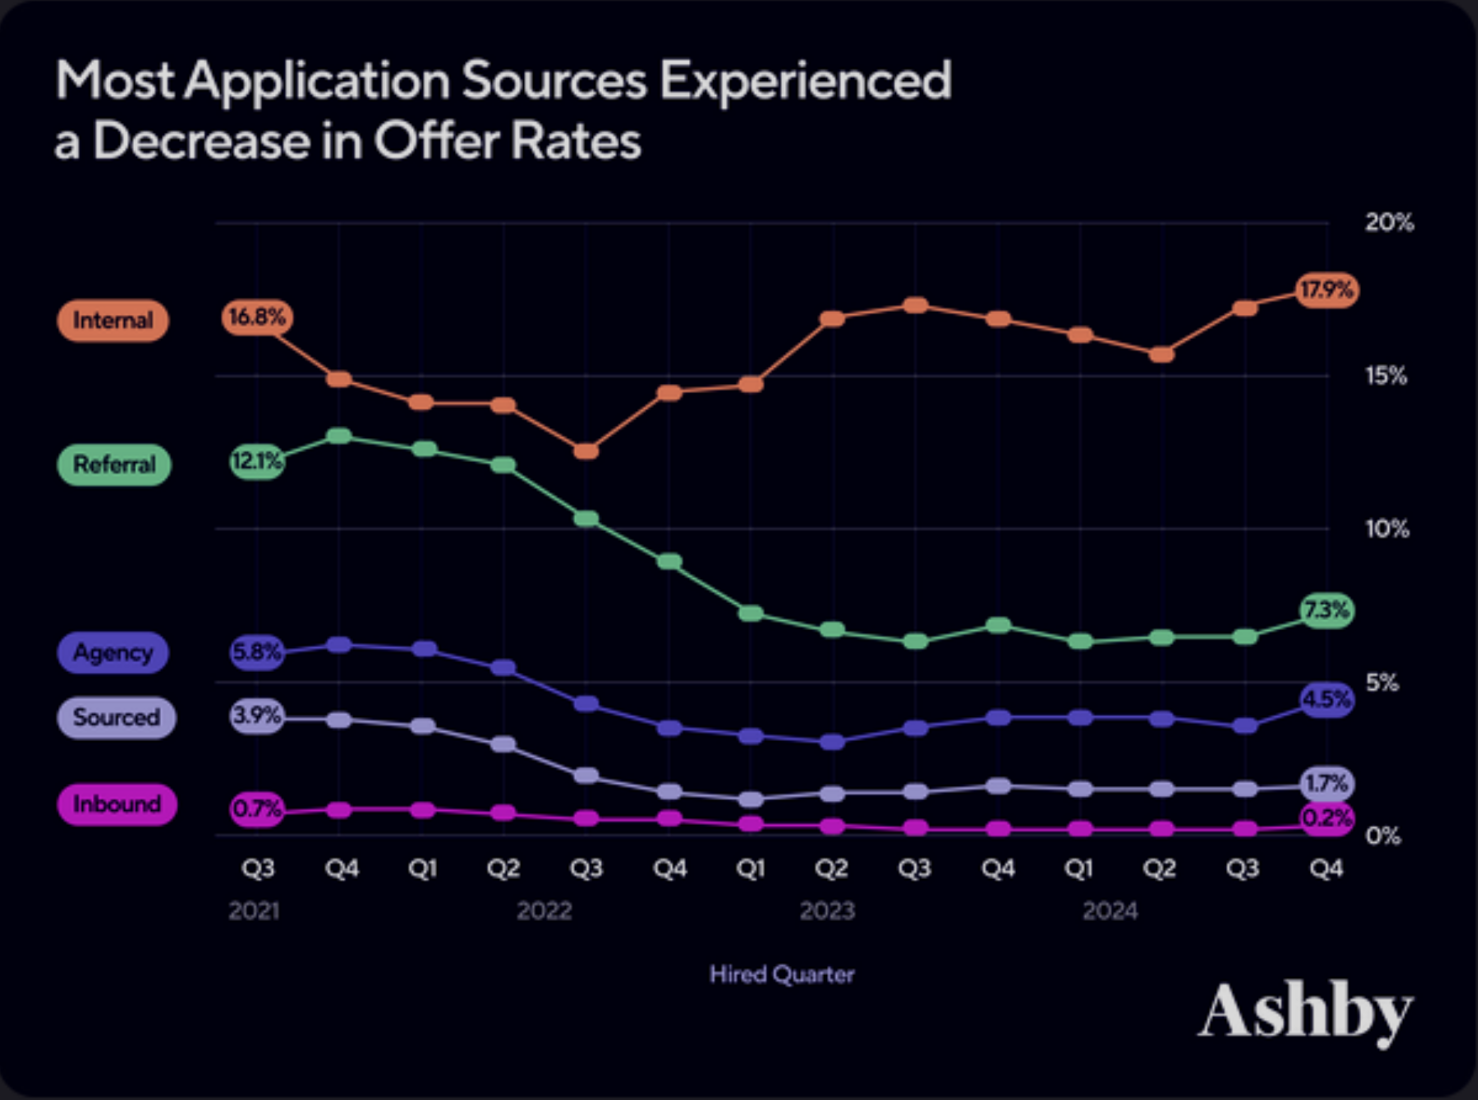
Is this offers/interview? Offers per application? Why is the averaging window 3 quarters? Why not 2? Or 4?
Are referred candidates still more likely to get hired? The answer to the title question isn’t actually explicitly answered in the body text.