This was a test given to me as part of a technical assessment from a video game studio. It asks the data scientist to create a report on a Live Event given mission completion and skip data aggregated by player level. In order to progress through the event, players either have to complete a series of missions -- broken up into 5 separate chapters -- or they can pay premium currency to skip missions.
Premium currency can be purchased at a rate of 100 for $4.99.
The original report was written as a PowerPoint slide deck. Stakeholders requested:
- A Churn Analysis that included:
- Identifying the missions with the largest player drop-off
- Splits by player-level groupings
- A Revenue Analysis that included:
- Total Revenue earned from the event
- Revenue by level
- Recommendations to improve future events
Article Summary
Domain: LiveOps Game Economy & Monetization Analytics
Core Problem: Severe early-game churn (78% drop in Chapter 1), broken difficulty pacing (loss of the "sawtooth" curve in Chapters 4–5), and erratic skip-cost scaling that alienated players and concentrated late-game revenue entirely on whale-tier final missions.
Methodology: Full-funnel cohort telemetry analysis, cross-tabulation of premium currency spend (skips) by mission and player level, and behavioral proxy modeling (using skip rates as a metric for real-time difficulty friction).
Key Findings:
Monetization Concentration: Chapter 1 accounted for 39.5% of total event revenue ($224,111 total), while Chapter 5 was an extreme "revenue desert" where 91.3% of chapter spend came from the final mission alone.
Pacing Collapse: The classic design pattern—a sawtooth difficulty curve building toward a rewarding climax—collapsed entirely in the back half of the event, rendering mid-chapter progression flat and unengaging.
Pricing Distortion: Inconsistent skip cost multipliers ($45 event finale skip price) signaled a "pay-to-win/whales-only" economy that risked long-term retention and new-player acquisition.
Outcome:
Delivered actionable design recommendations to restructure early-game onboarding friction, reintroduce multi-wave pacing in long chapters, smooth out cost multipliers, and reposition penultimate vs. finale mission balancing.
Table of Contents
Revenue Analysis
Revenue: Overall
|
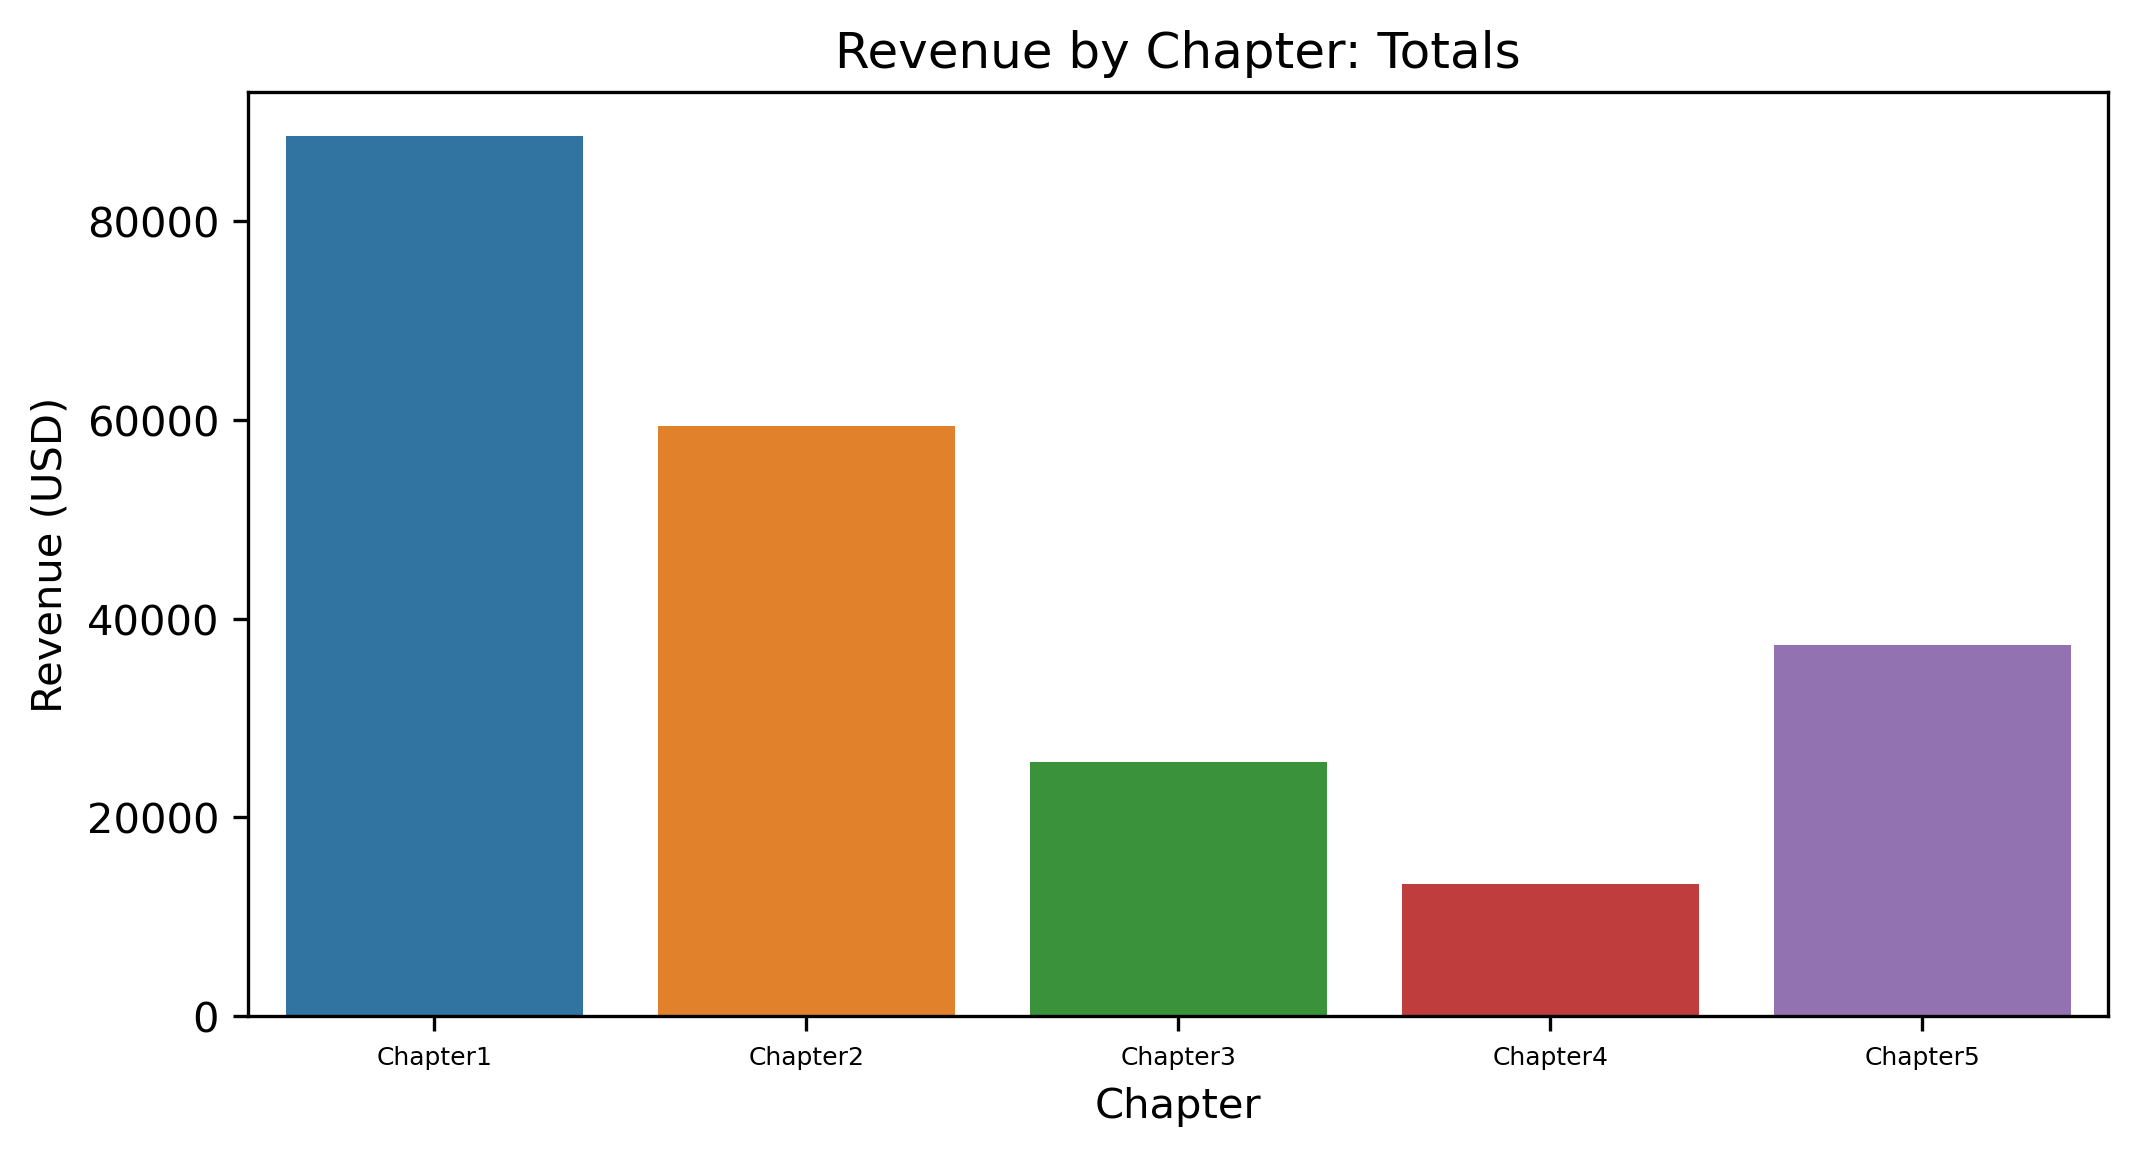
Users spent 4491210 premium currency, generating $224,111 over the course of the event Revenue per Chapter peaks at Chapter 1, with 39.5% of the total, trends progressively downward until Chapter 5, where it rebounds somewhat on the back of the high mission skip cost for the final mission
|
 |
Revenue: Mission Splits
|
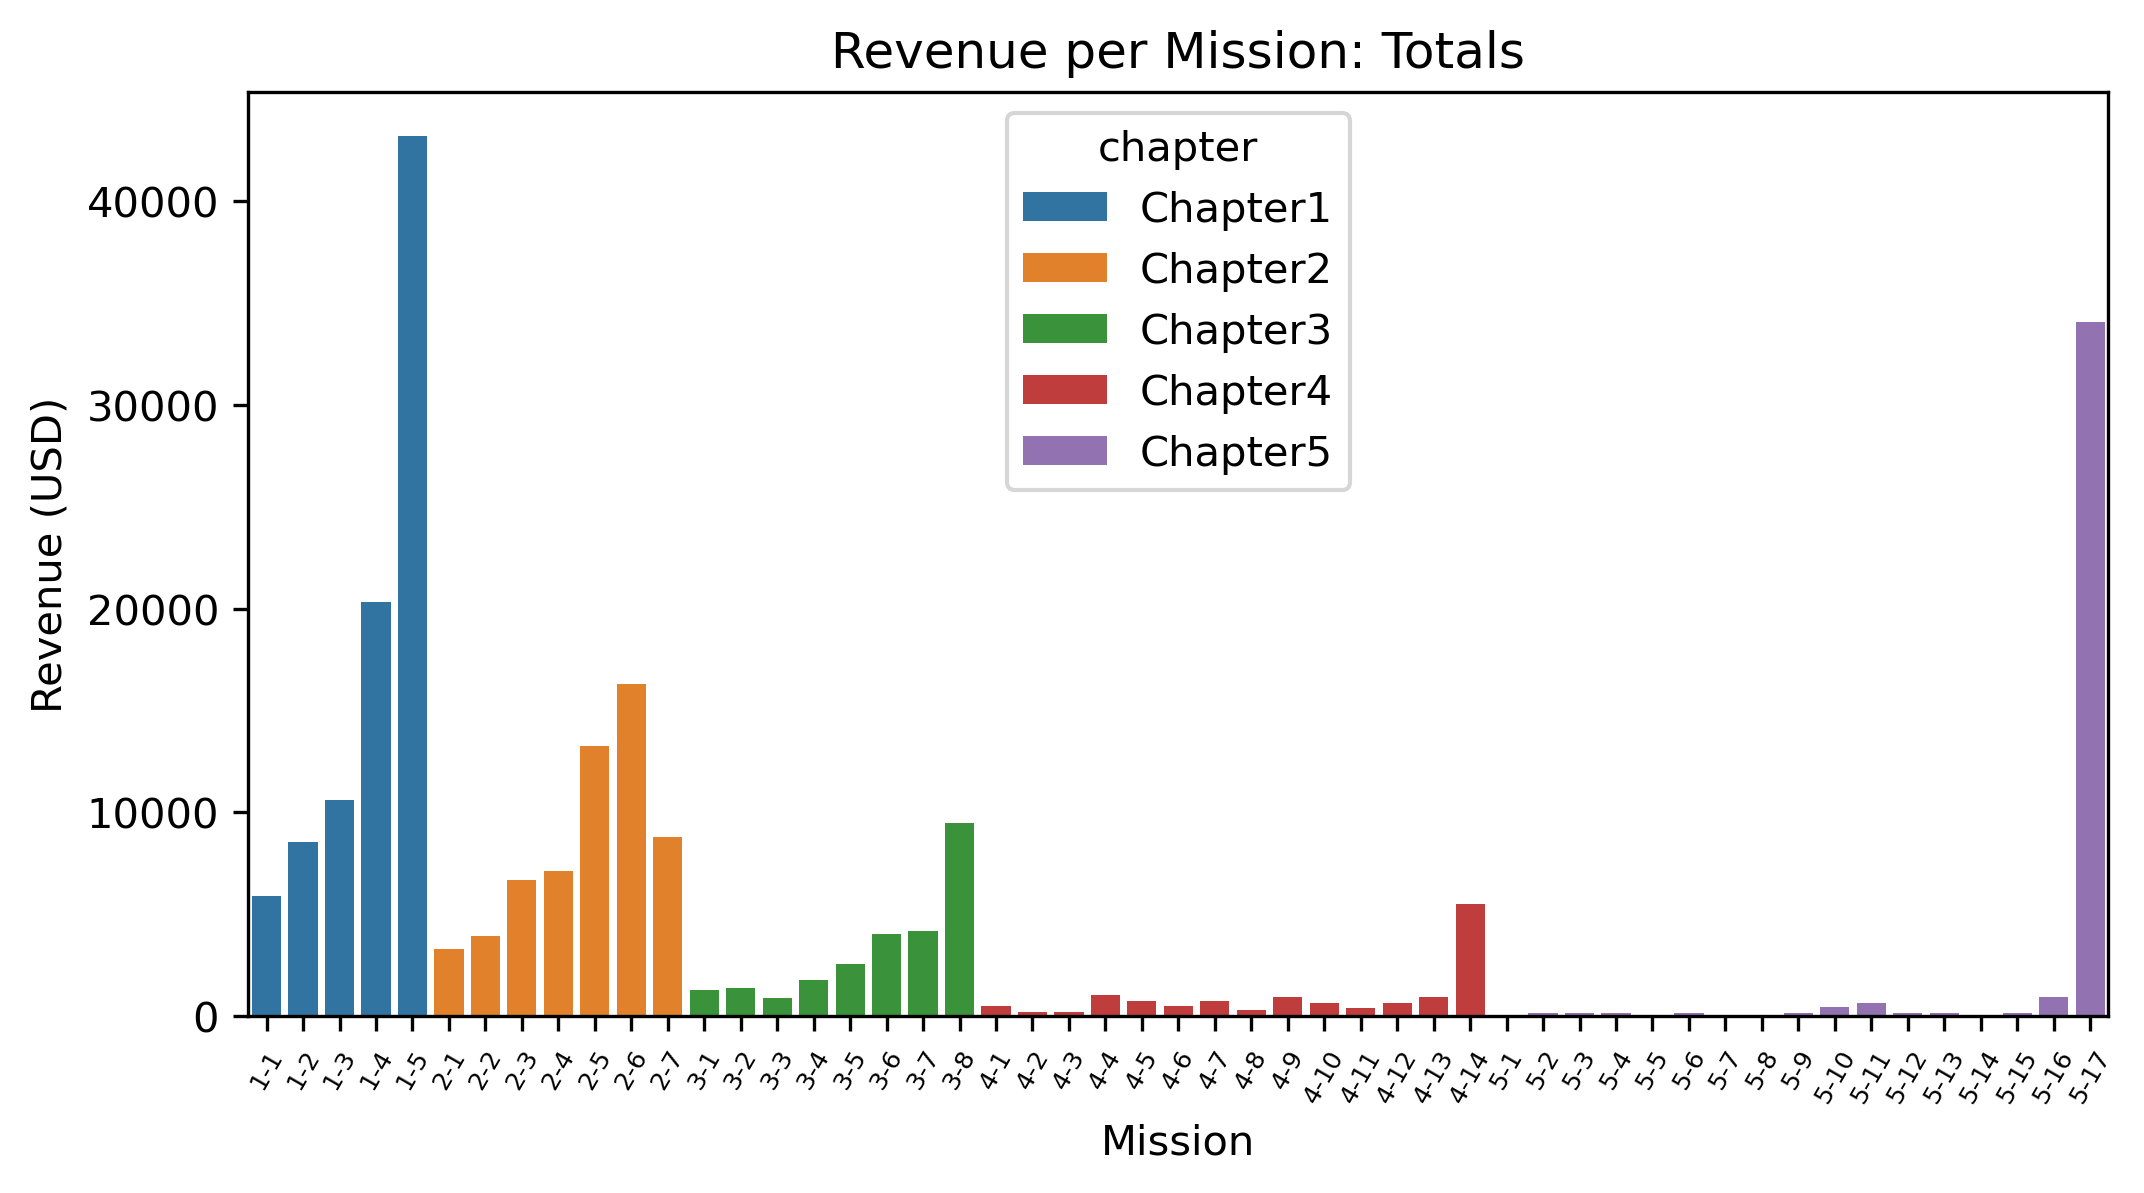
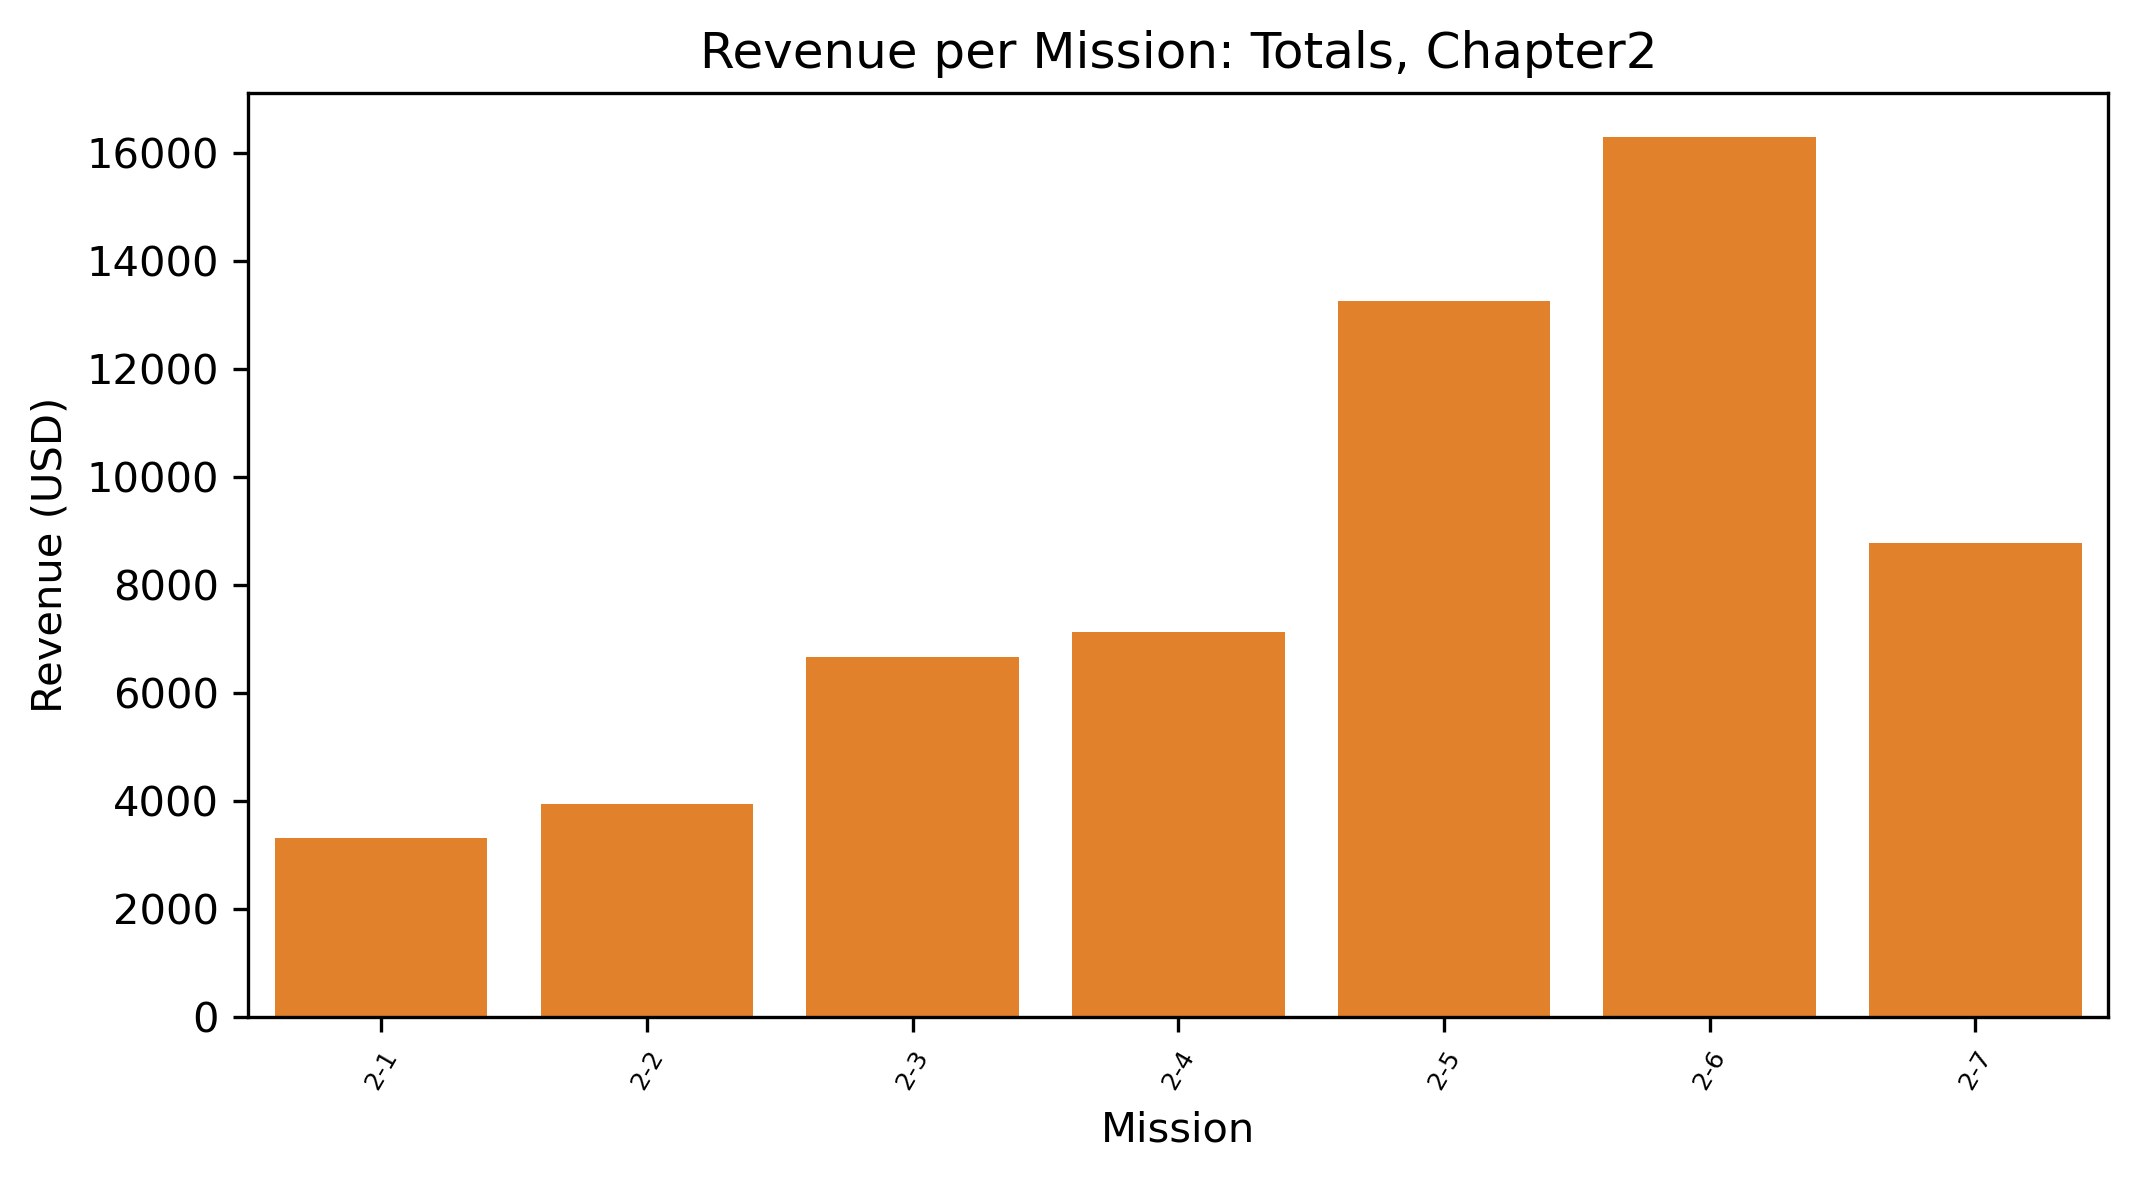
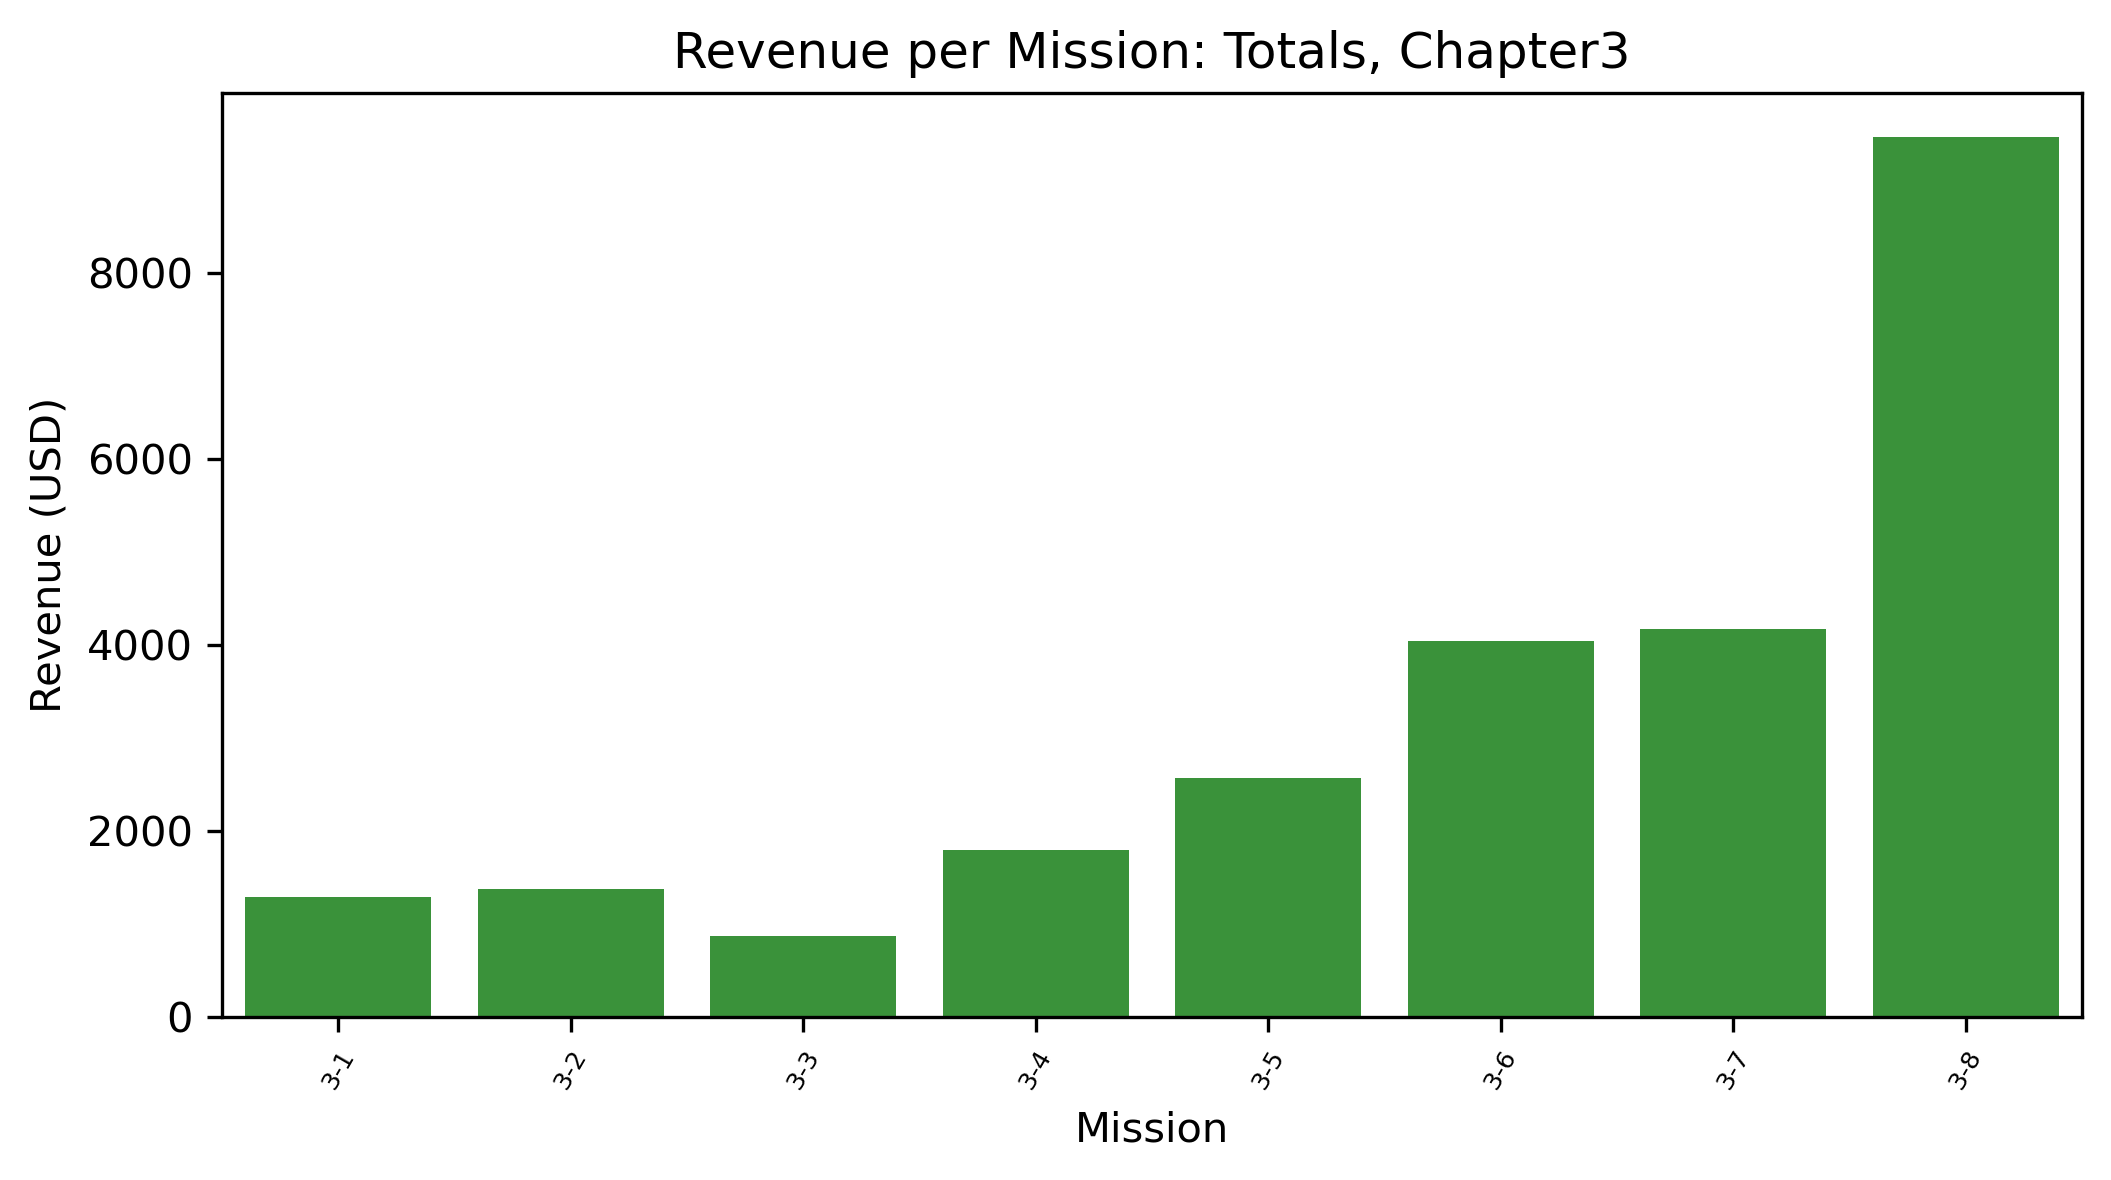
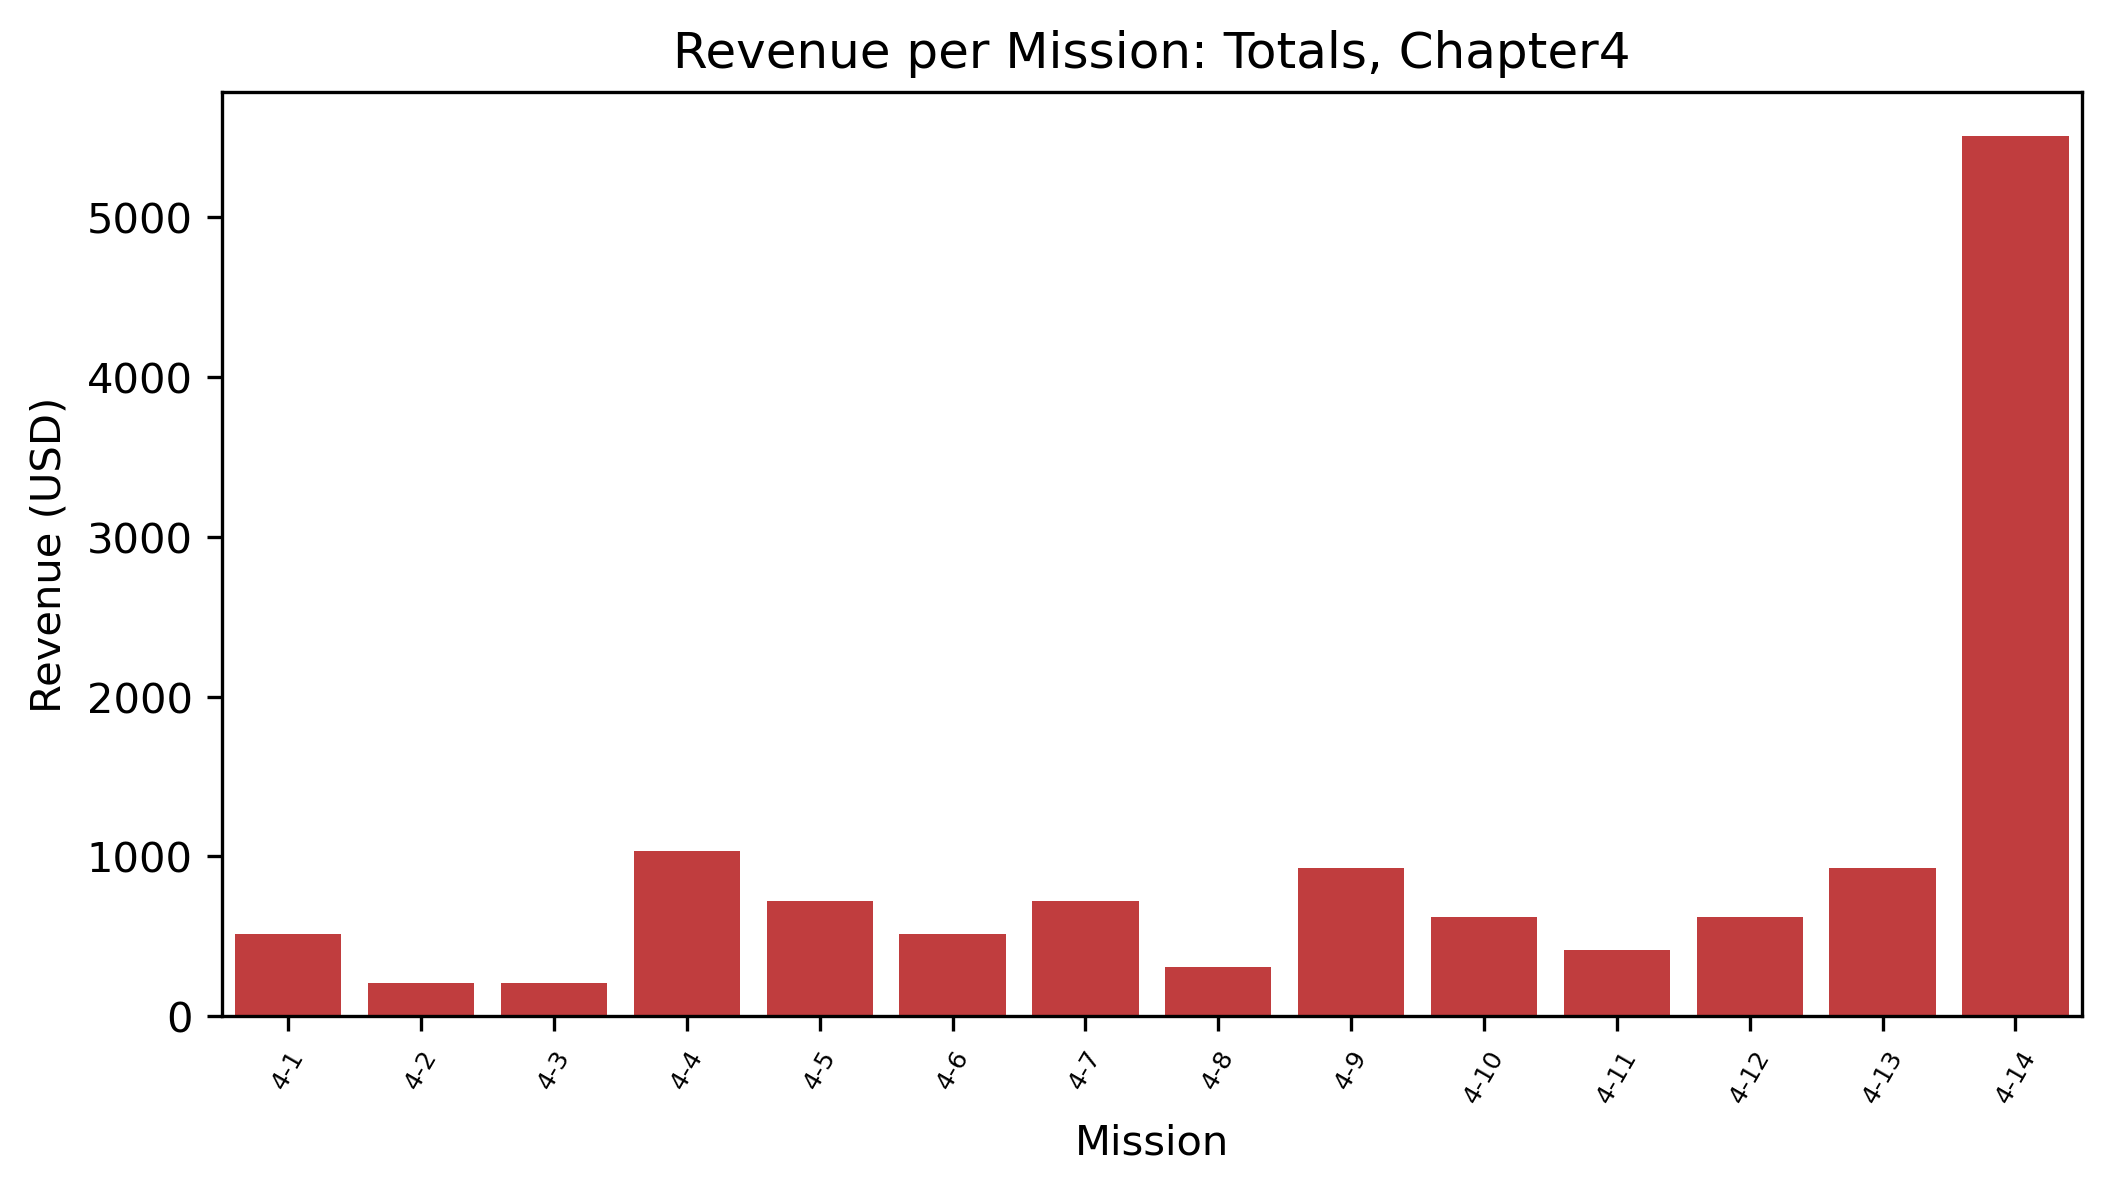
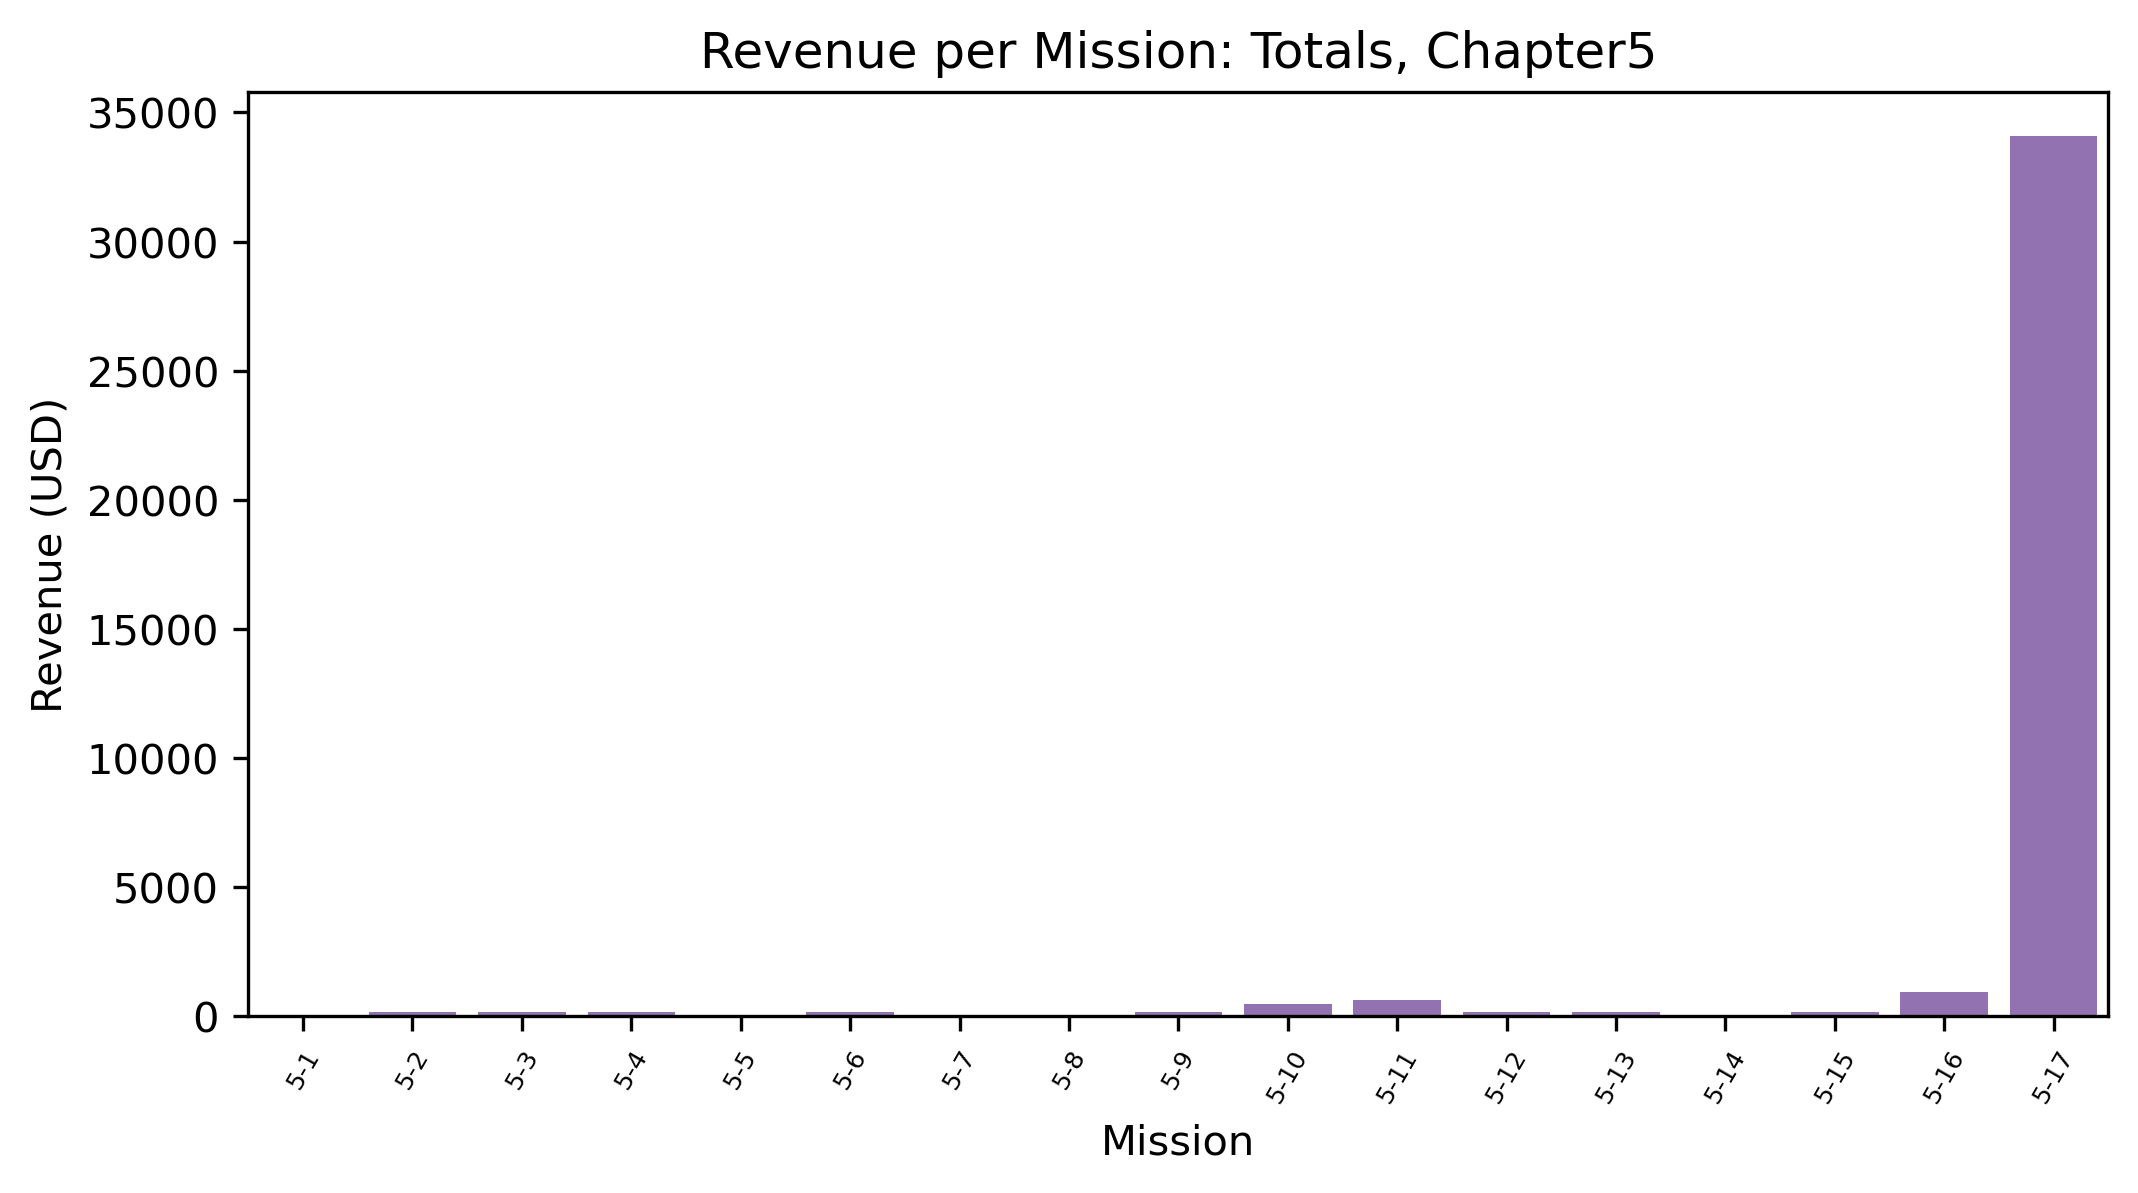
The final mission in each chapter drew the most revenue, save for Chapter 2, where the penultimate mission (2-6) took the lead instead. Revenue for each chapter generally grows over the course of the chapter through Chapter 3, consistent with the expected saw-tooth pattern of missions building toward a costly finale. This pattern breaks down entirely in Chapters 4 and 5, where non-finale missions account for only marginal spending. Here, revenue becomes almost exclusively finale-driven, suggesting the escalating structure seen in earlier chapters simply isn't present in the back half of the event. |
|
Revenue: Mission Splits
|
The chapter finales combined generated $101,055, which accounts for 45.1% of all event spending. Looking at Chapter 2 Mission 6, rather than the finale at Mission 7, this number climbs to $108,578, or 48.4% of total event spending. On a per-chapter basis, the chapter finales accounted for
This shows quite clearly that Mission 2-7 is underperforming relative to the rest of Chapter 2, while Chapter 5 is a revenue desert outside of the final mission.
|
|
Revenue: Mission Splits
     |
Revenue: Mission Splits
|
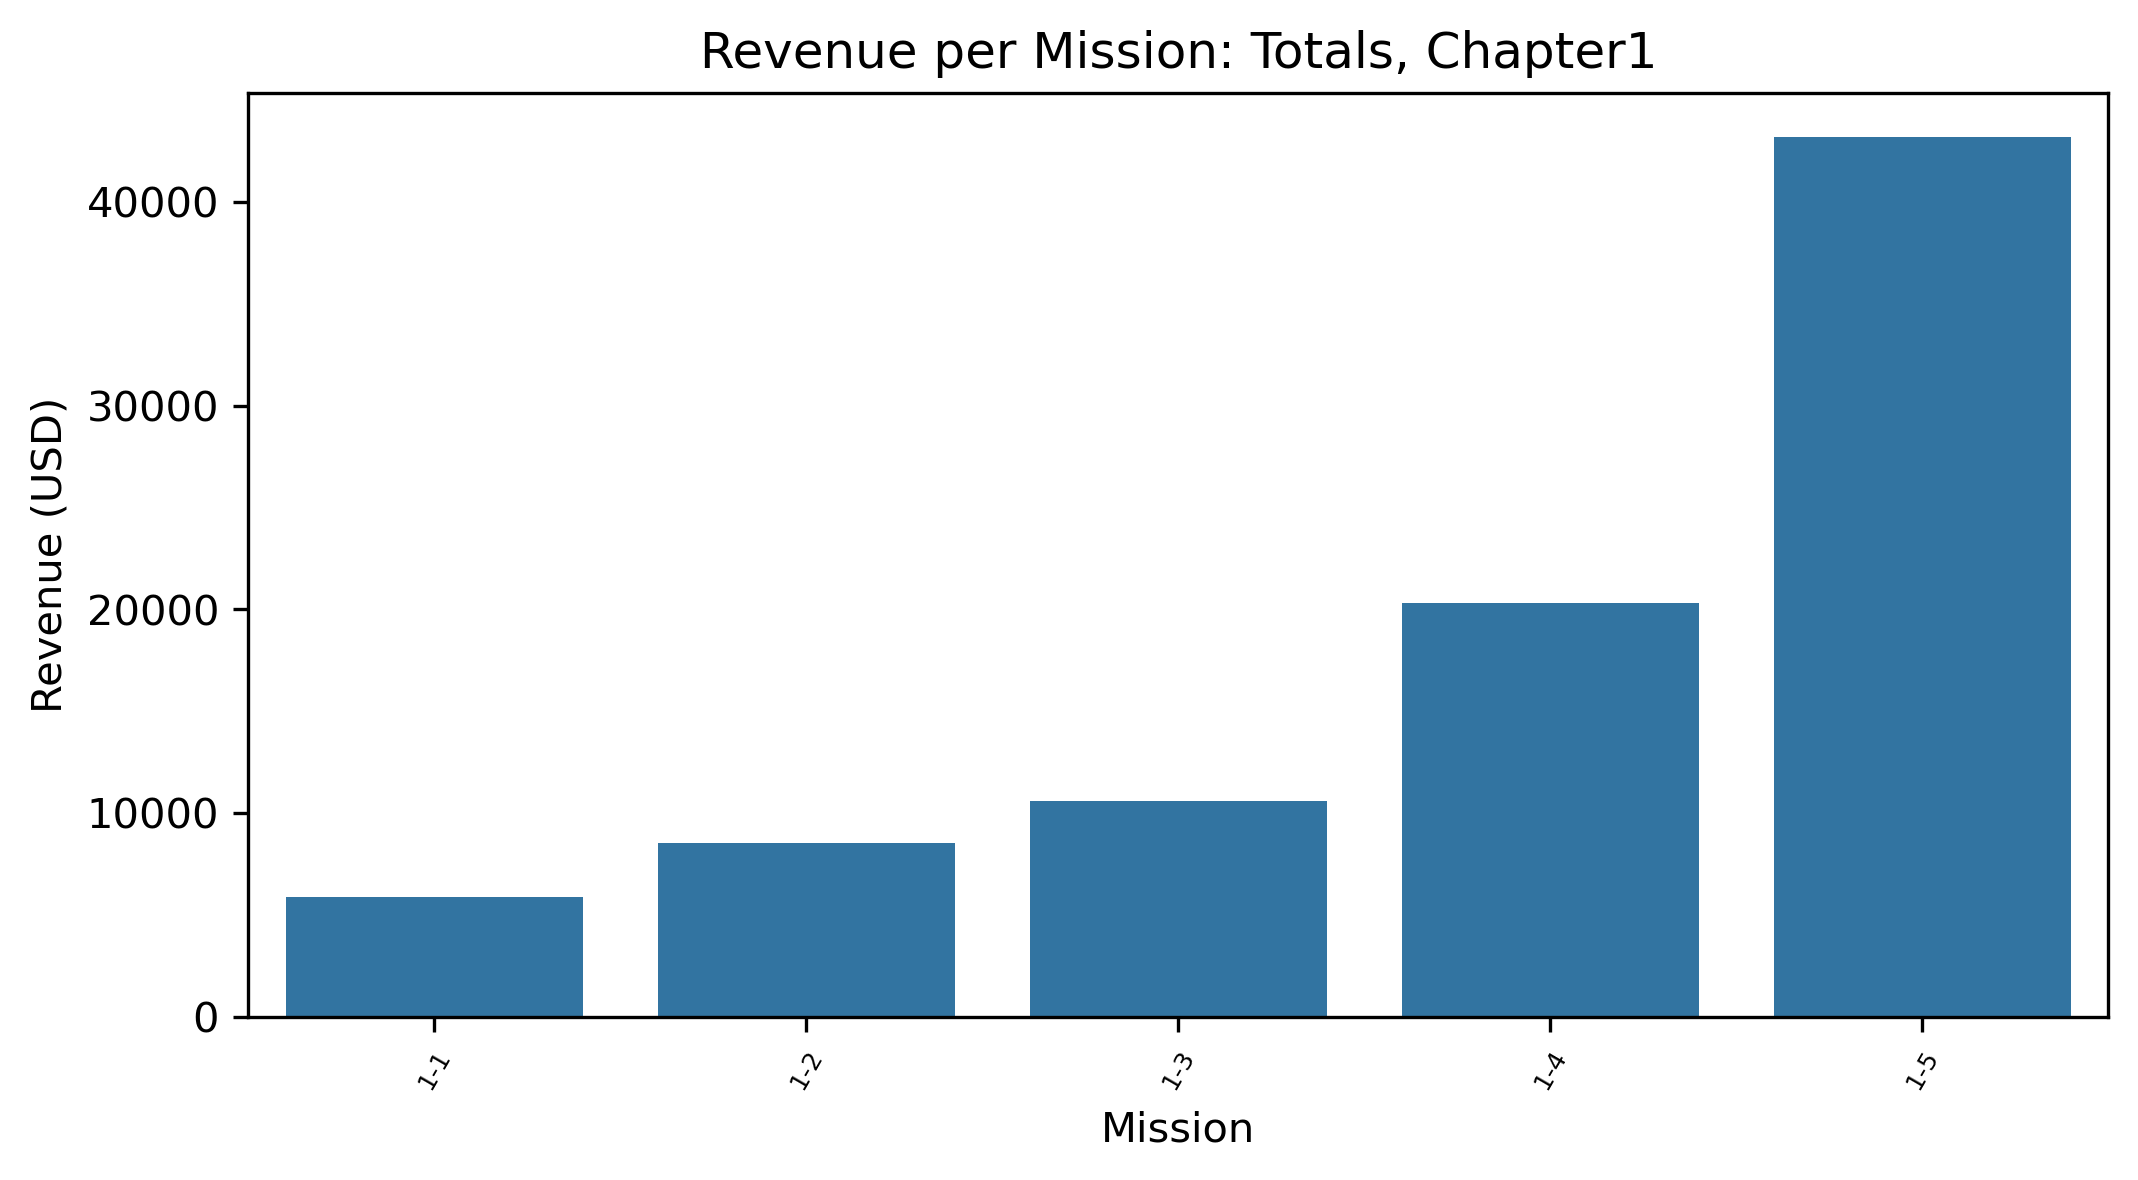
Revenue from mission skipping should be a good proxy for mission difficulty (with the exception of the final chapter missions, which are priced significantly higher than previous missions). The first three chapters illustrate a classic Sawtooth pattern in revenue, rising toward the end of the chapter, and resetting at the start of the next. This is a common difficulty curve used in games with linear progressions, as it provides both a sense of rising stakes, progressing towards a climax, and a sense of power growth and achievement following the challenge reset. |
|
Revenue: Mission Splits
|
The final two chapters do not show this sawtooth pattern, suggesting that difficulty may be flat, and even insignificant relative to player level at this stage of the event. Both Chapter 4 and Chapter 5 are significantly longer than the first three chapters, as well, and can support their own internal challenge patterns (e.g. sawtooth, wave, or step-function curves) to keep players engaged, but the evidence is weak-to-nonexistent that such patterns exist here.
|
|
Revenue: Level Splits
|
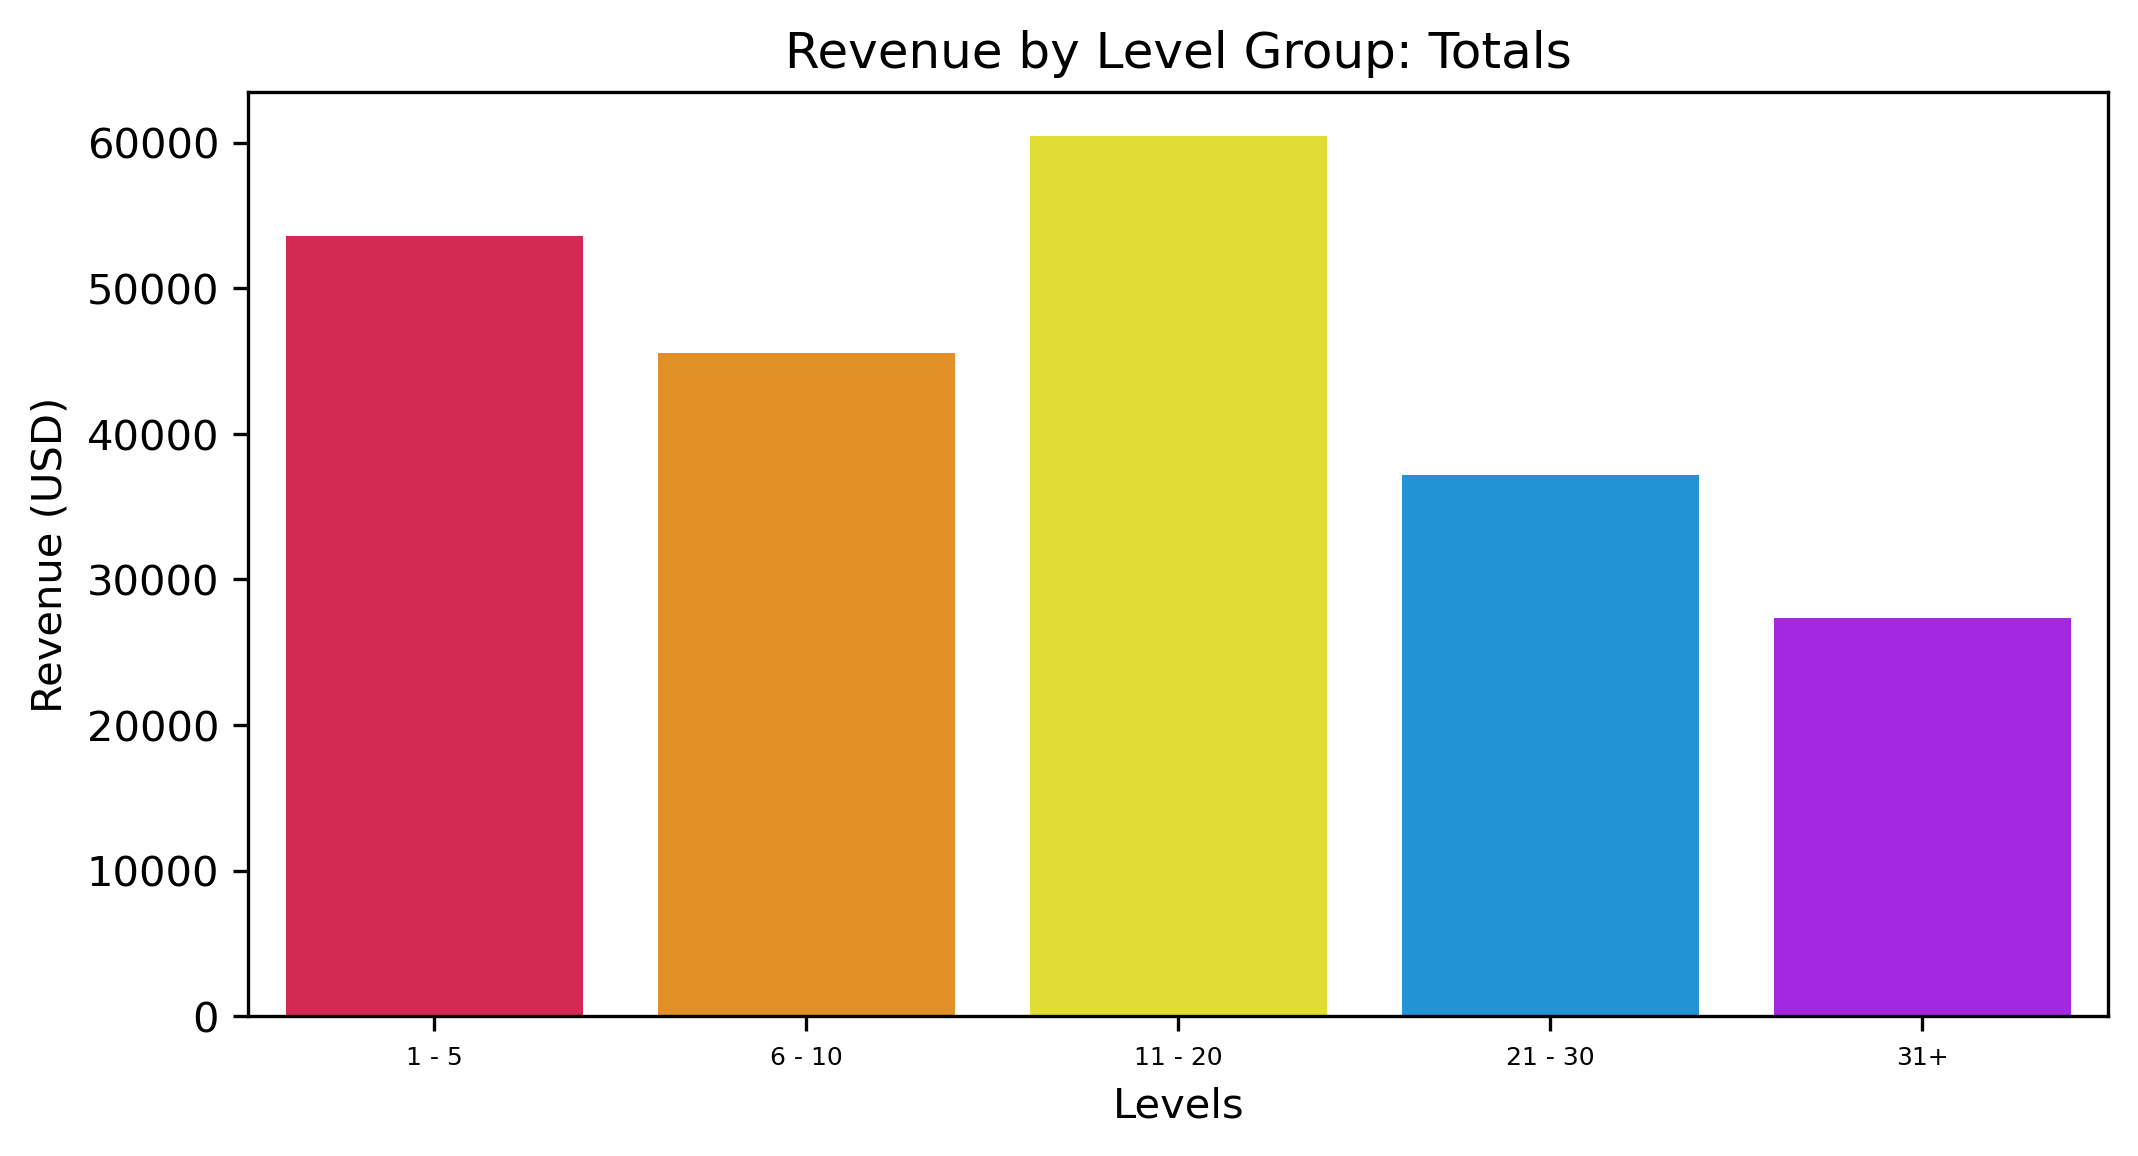
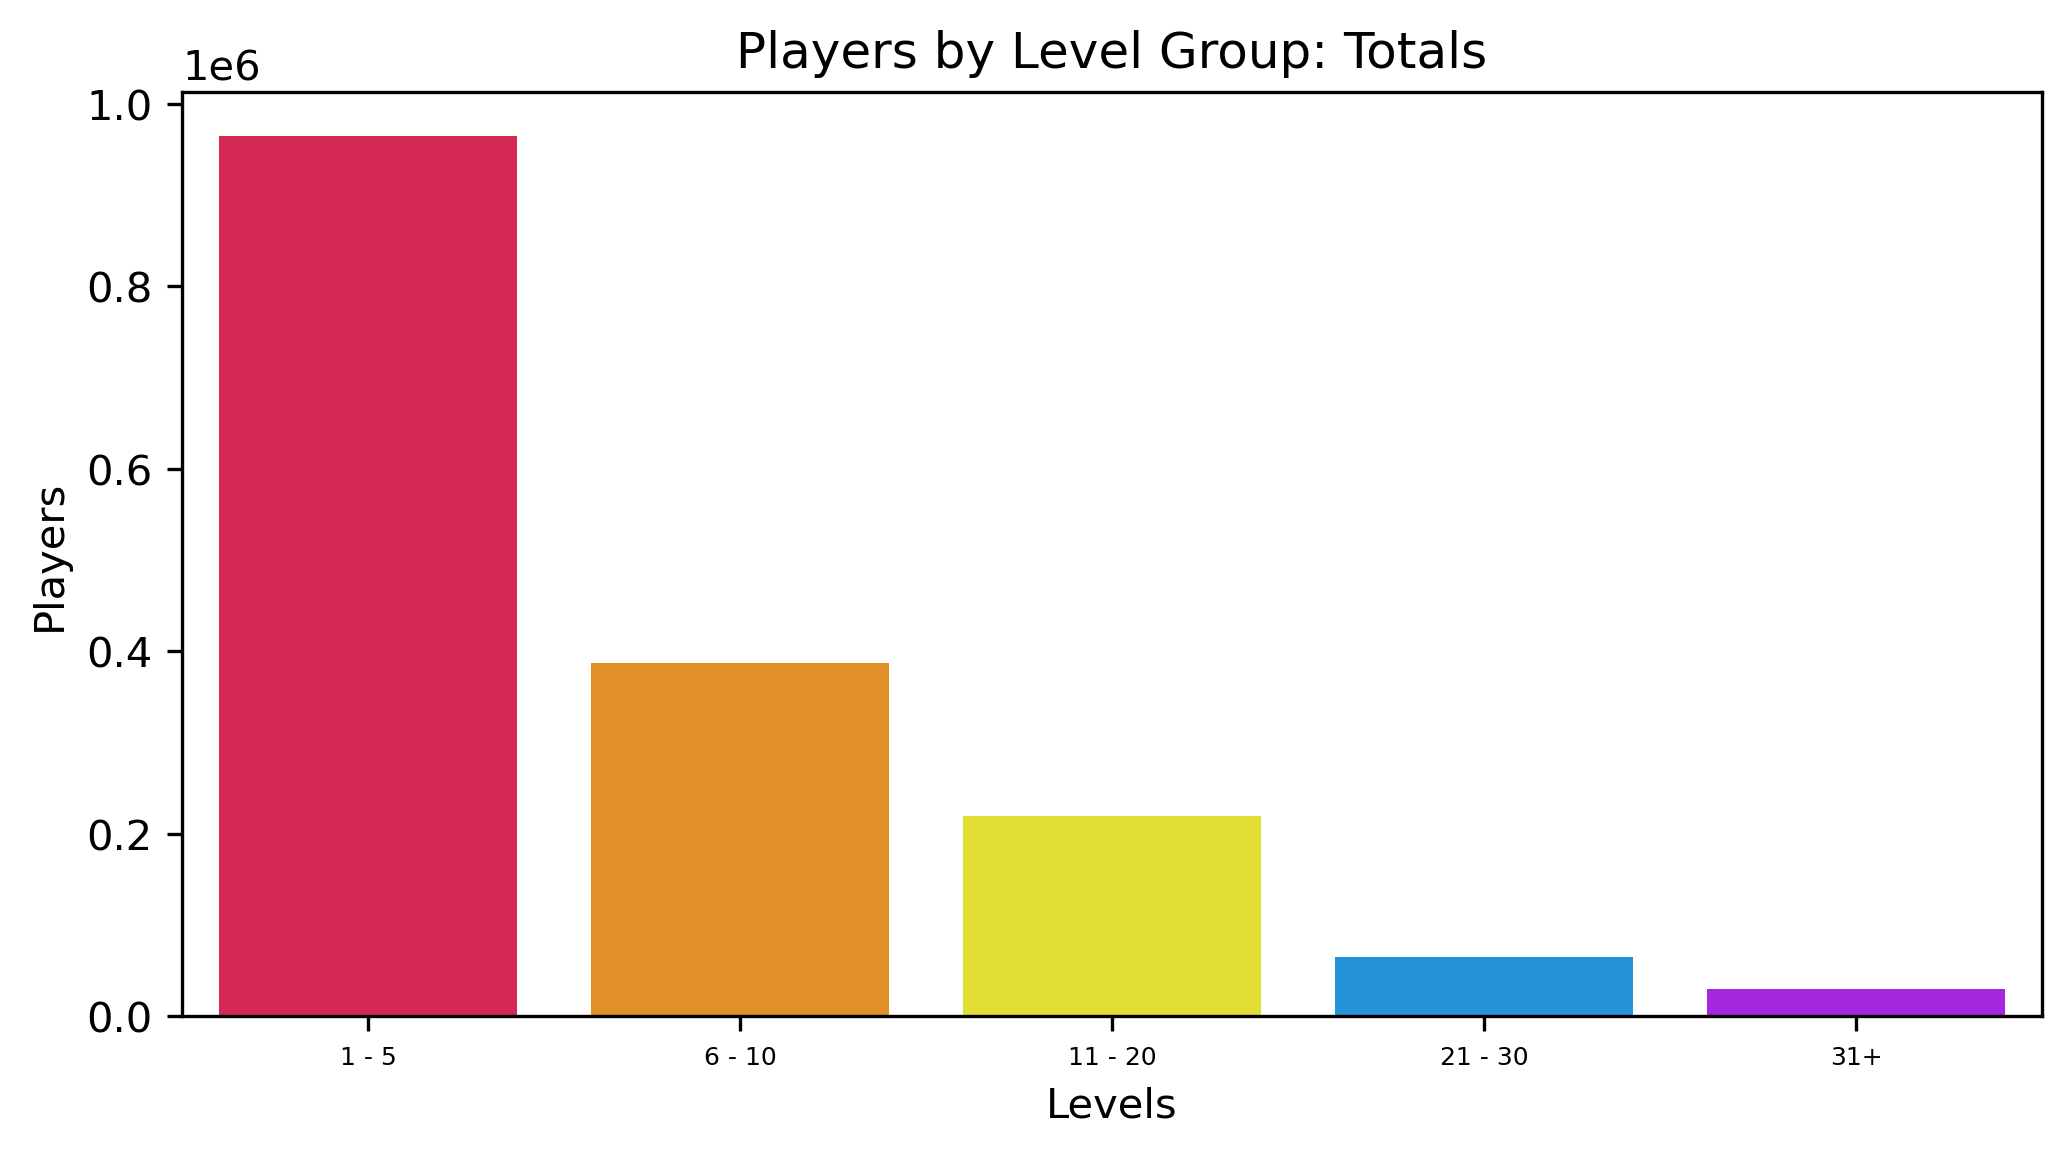
Revenue exhibits a slow, linear decline from low levels to high levels, which is expected given the population distribution of the game and of the mission skip pricing.
The exception at levels 11 — 20 is interesting, and is due to players at this cohort having significant access to all five chapters (as indicated on the next slide) — something that may indicate that chapters 4 and 5 are undertuned.
|
|
Revenue: Level Splits
   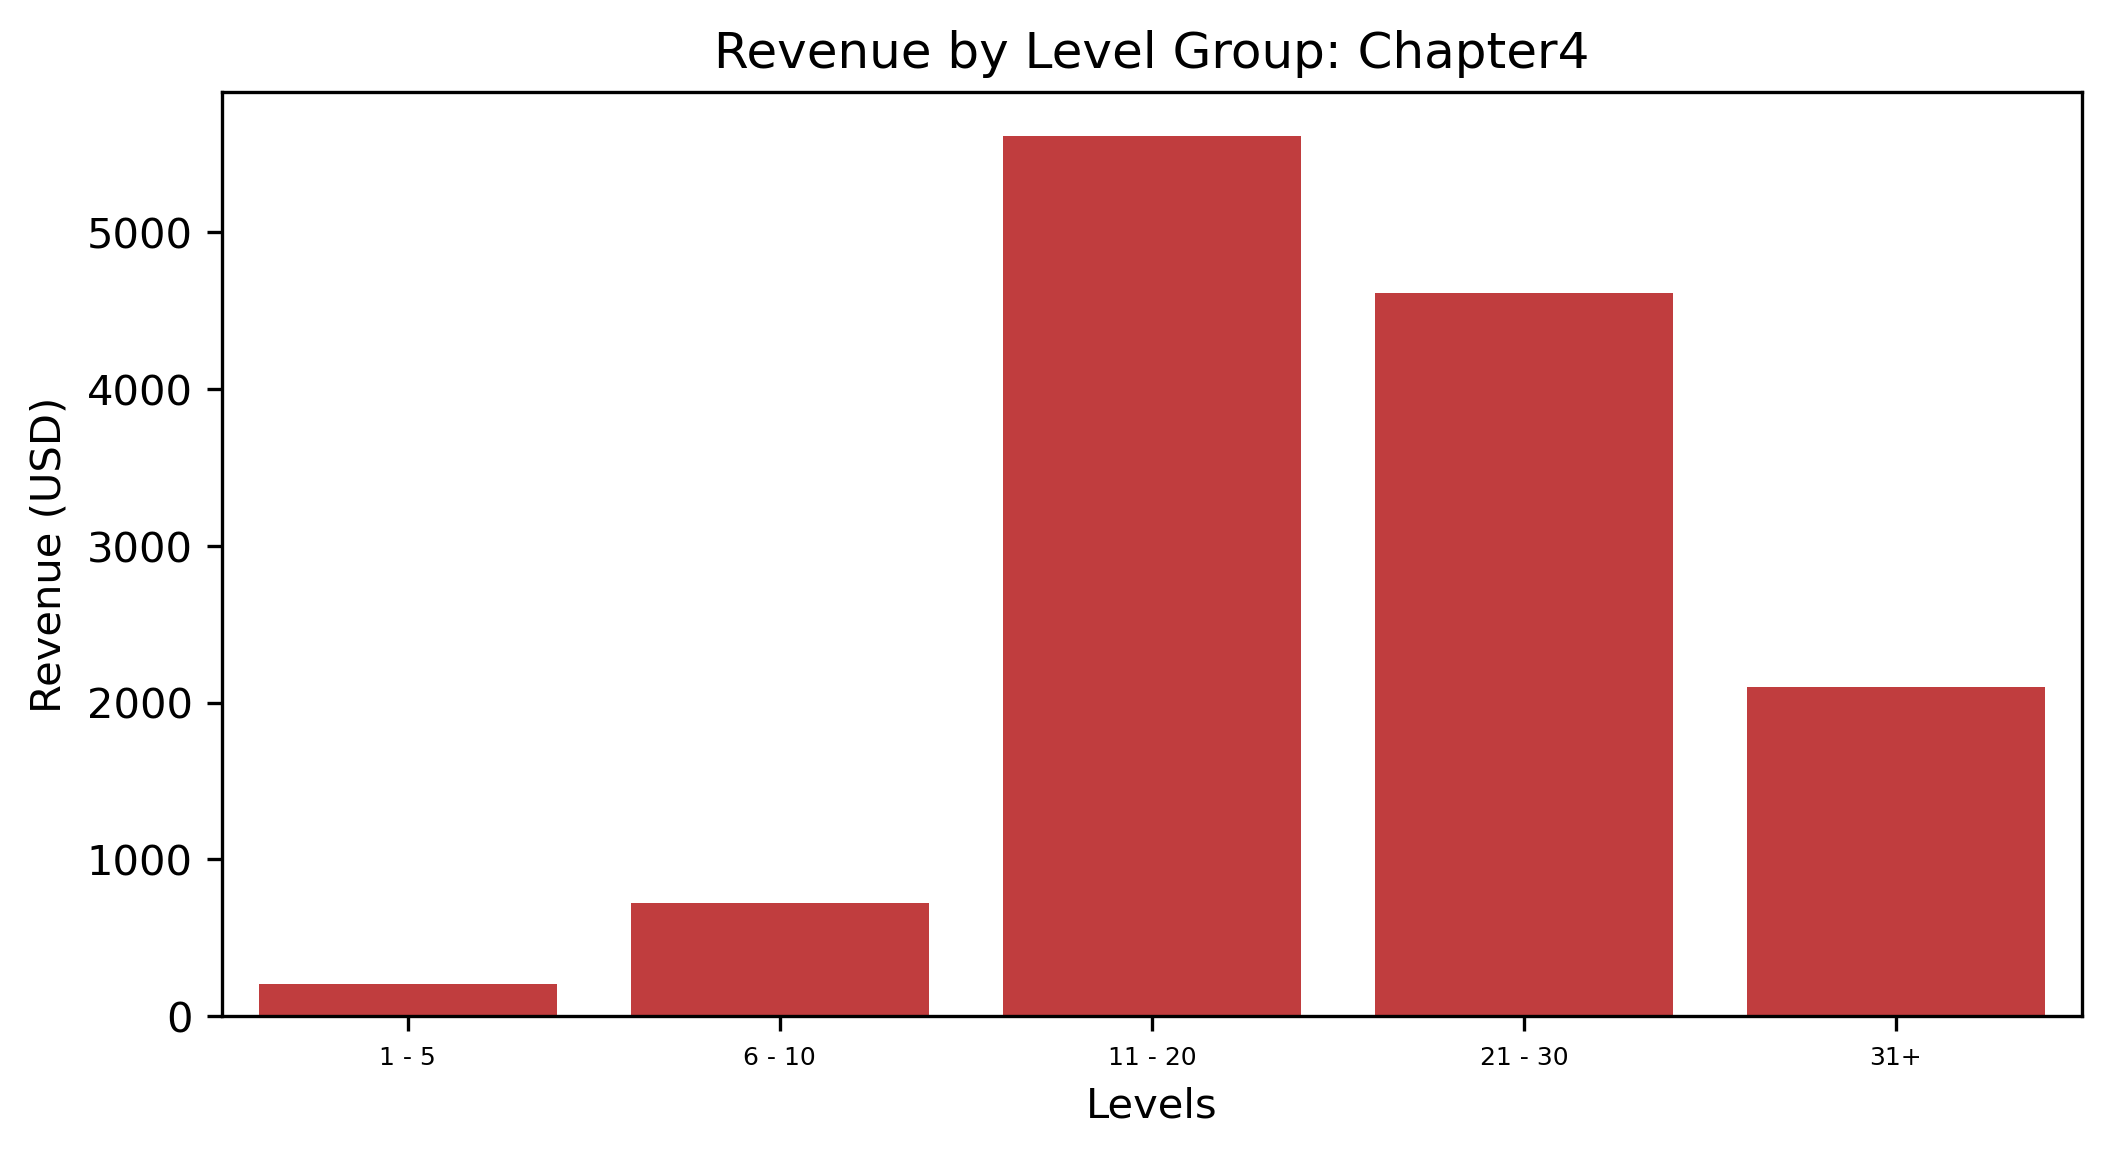 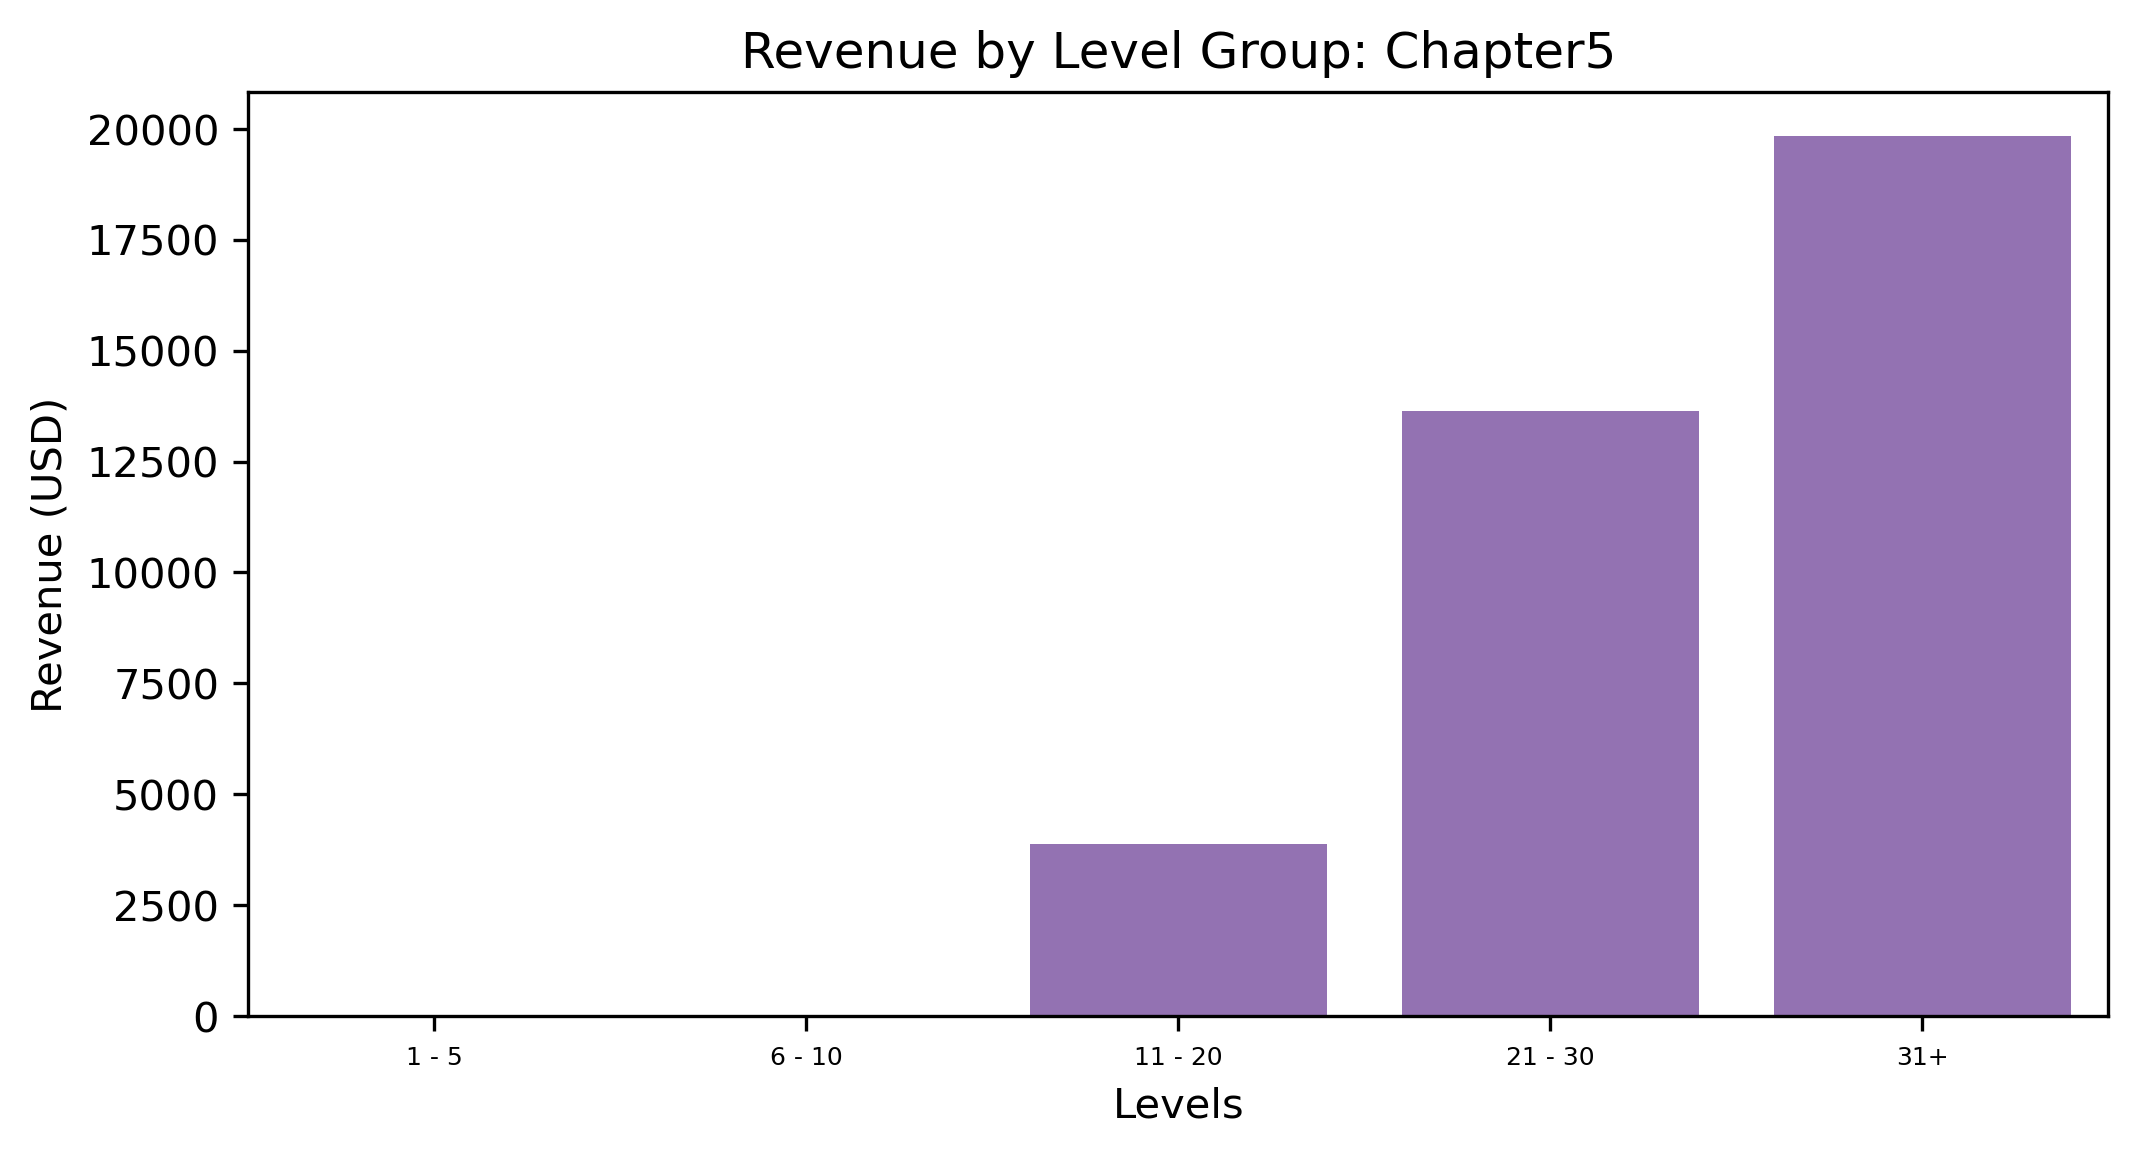 |
Revenue: Level Splits
|
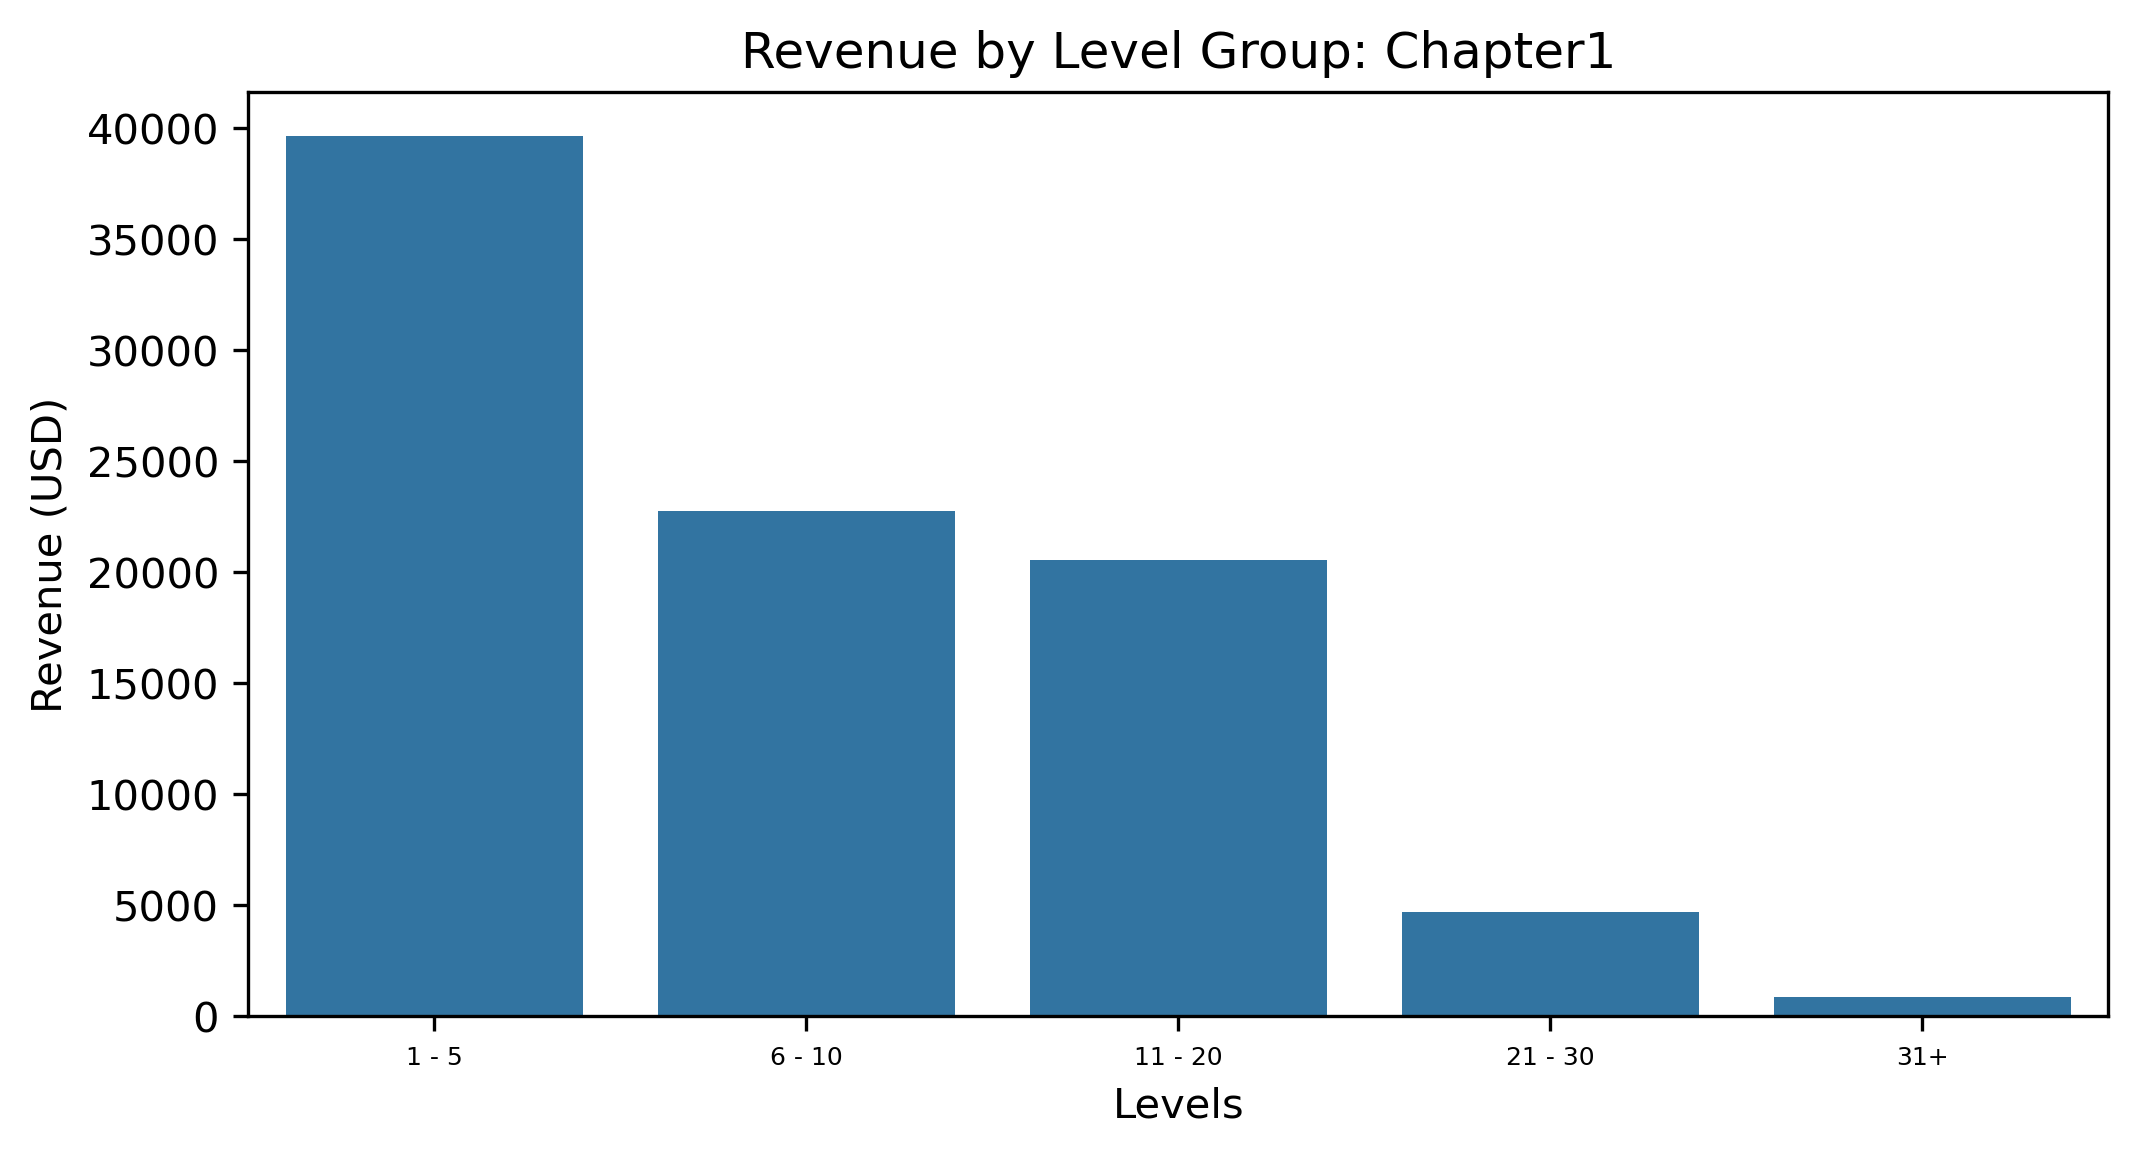
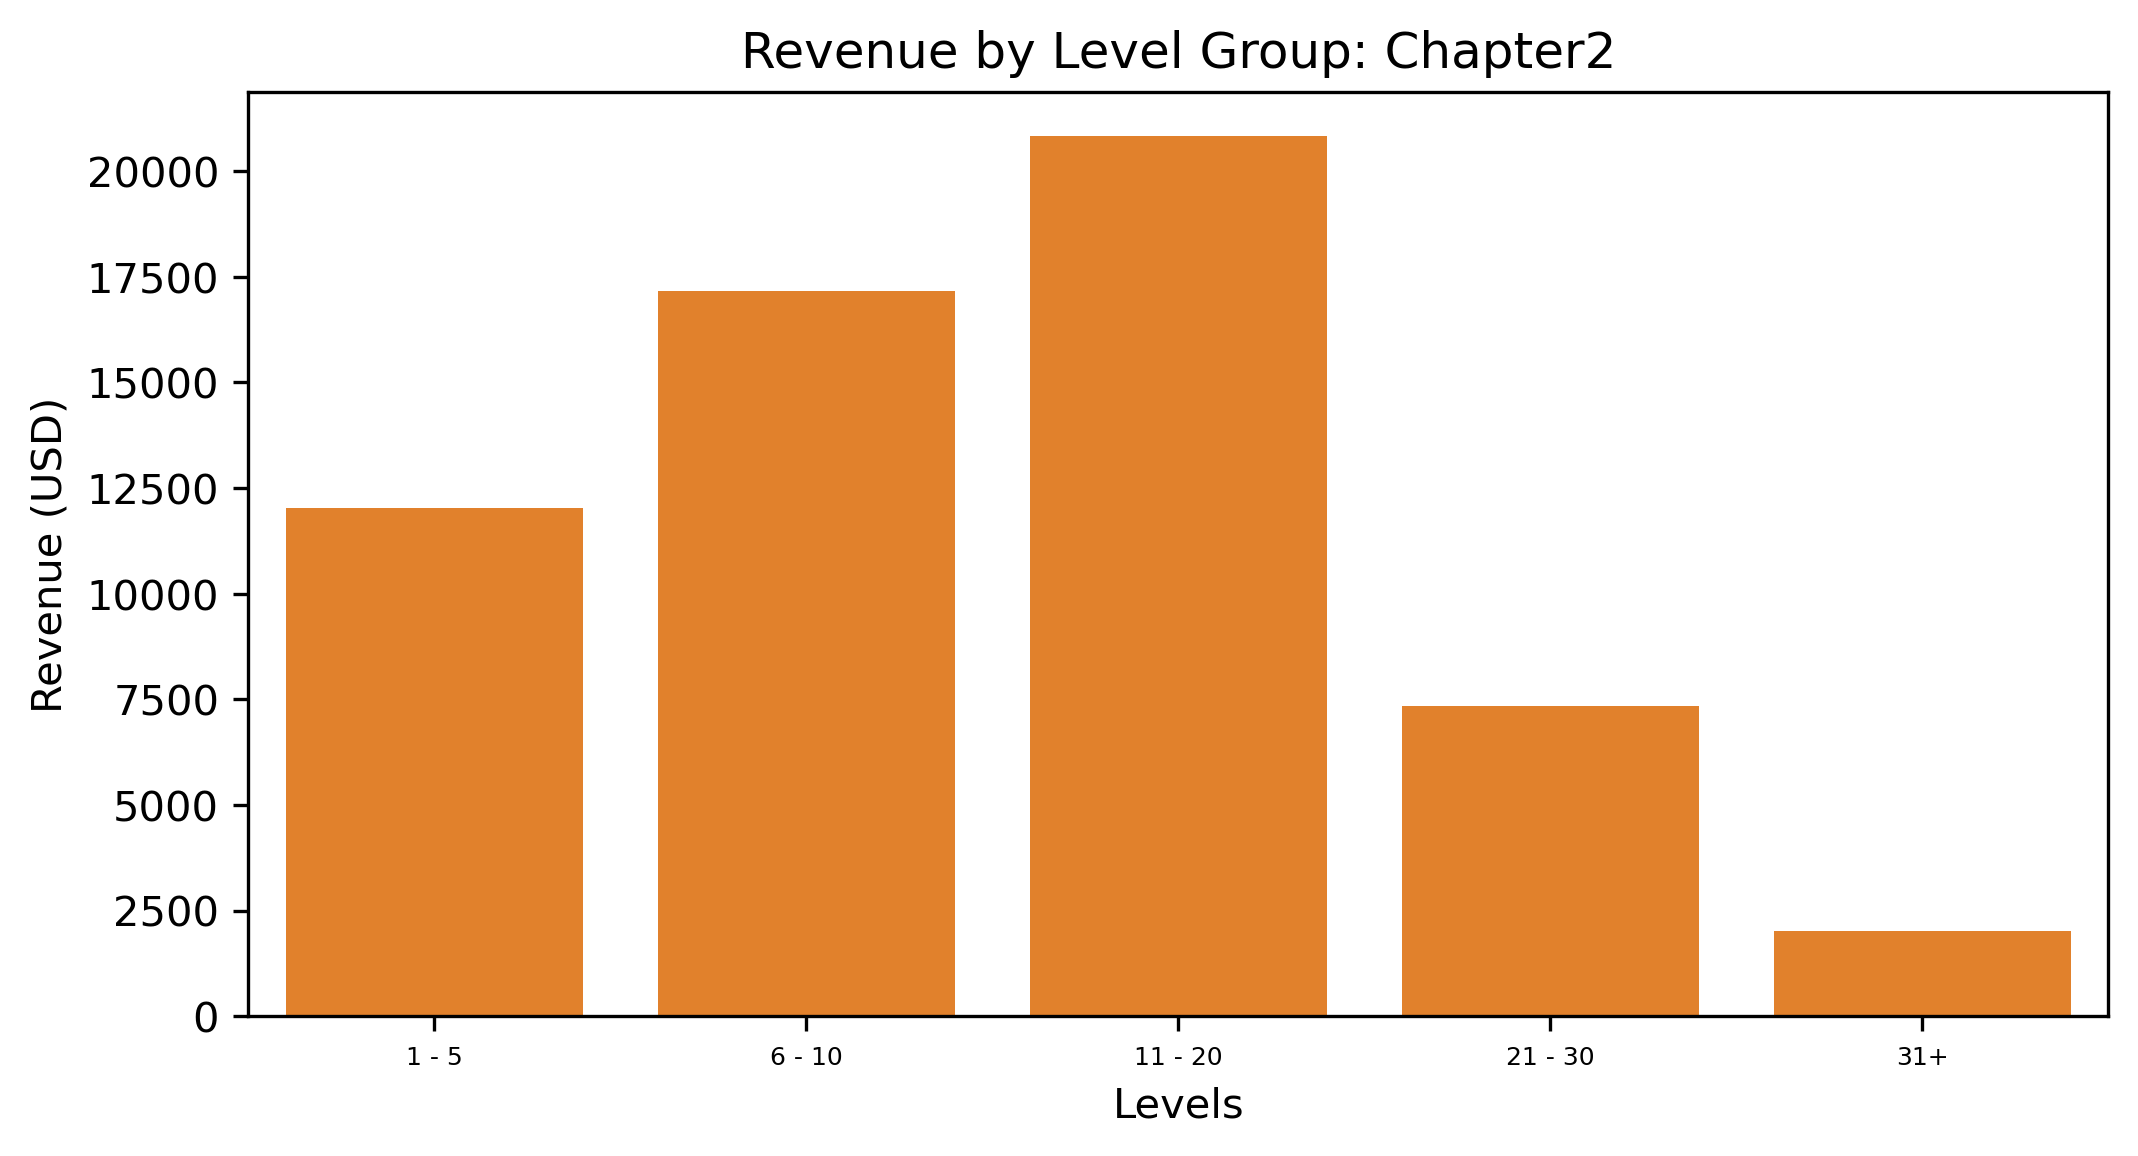
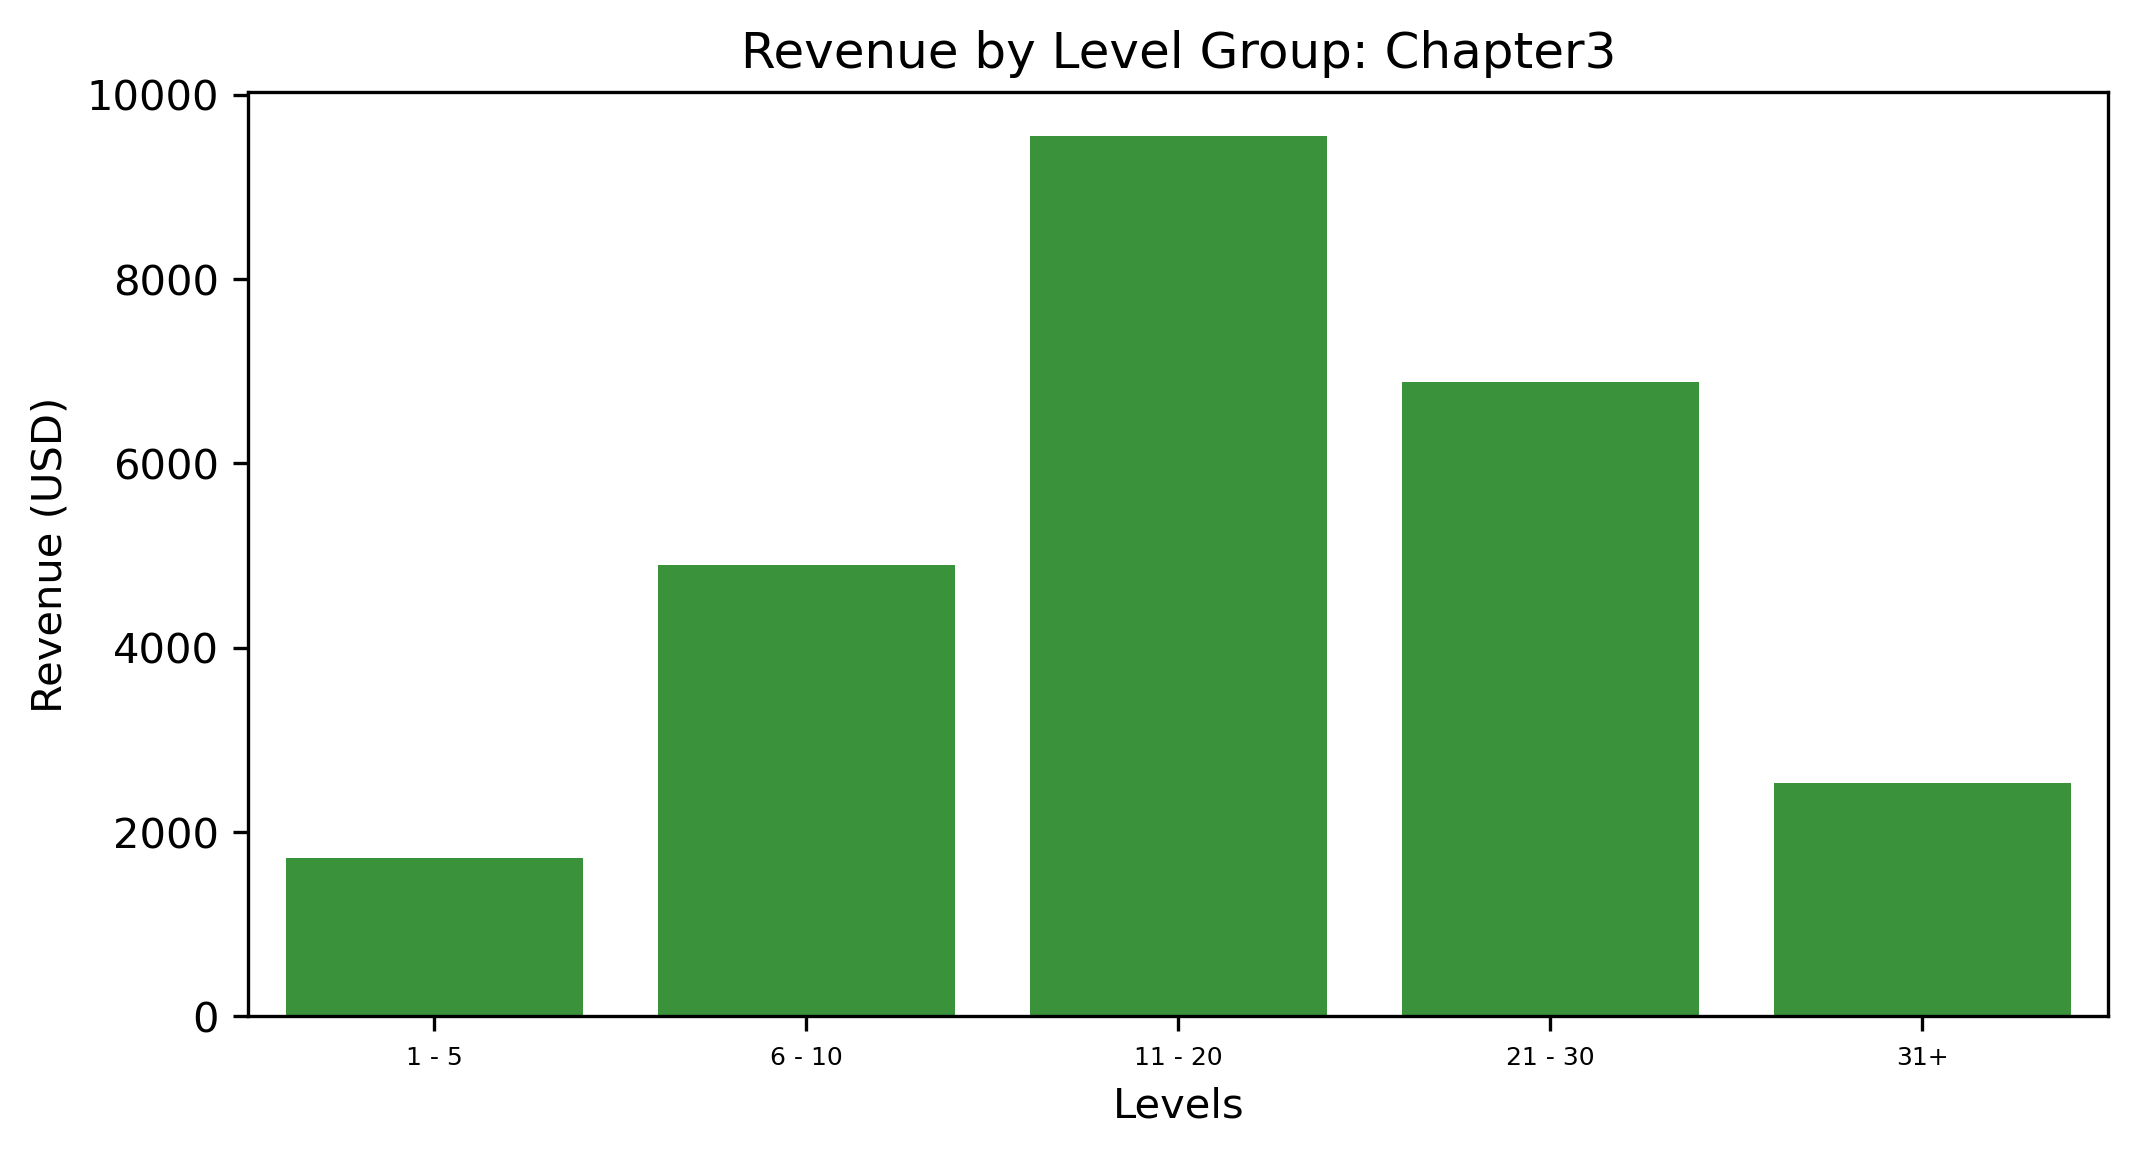
As expected, players at Levels 1 — 5 are predominantly spending in Chapter 1, with some spillover into Chapter 2. Players at Levels 6 — 10 are splitting their spending between Chapters 1 and 2 fairly evenly. Meanwhile, players at higher levels (21+) are not spending significant amounts in early chapters (with spending only starting to come online in Chapter 3). Players at Levels 11 — 20 are spending significant sums in all three early chapters, and even in Chapter 4 (next slide). This is a surprising range of spending for a group that is in the lower half of the level spectrum seen in the event.
|
|
Revenue: Level Splits
|
Some spending from players at Levels 11 — 20 is seen in Chapter 5, but it is small compared to other chapters and other level ranges. Spending from Levels 21 — 30 and 30+ is mostly concentrated in Chapter 5, and since we know that almost no spending occurred in Chapter 5 prior to the final mission, almost all of this can be attributed to Mission 5-17. This suggests that players at Level 21+ all have the same functional range in the event. It’s possible the only significant difference between players at these levels is the amount of premium currency they have to spend.
|
|
Retention Analysis
Retention Funnel
|
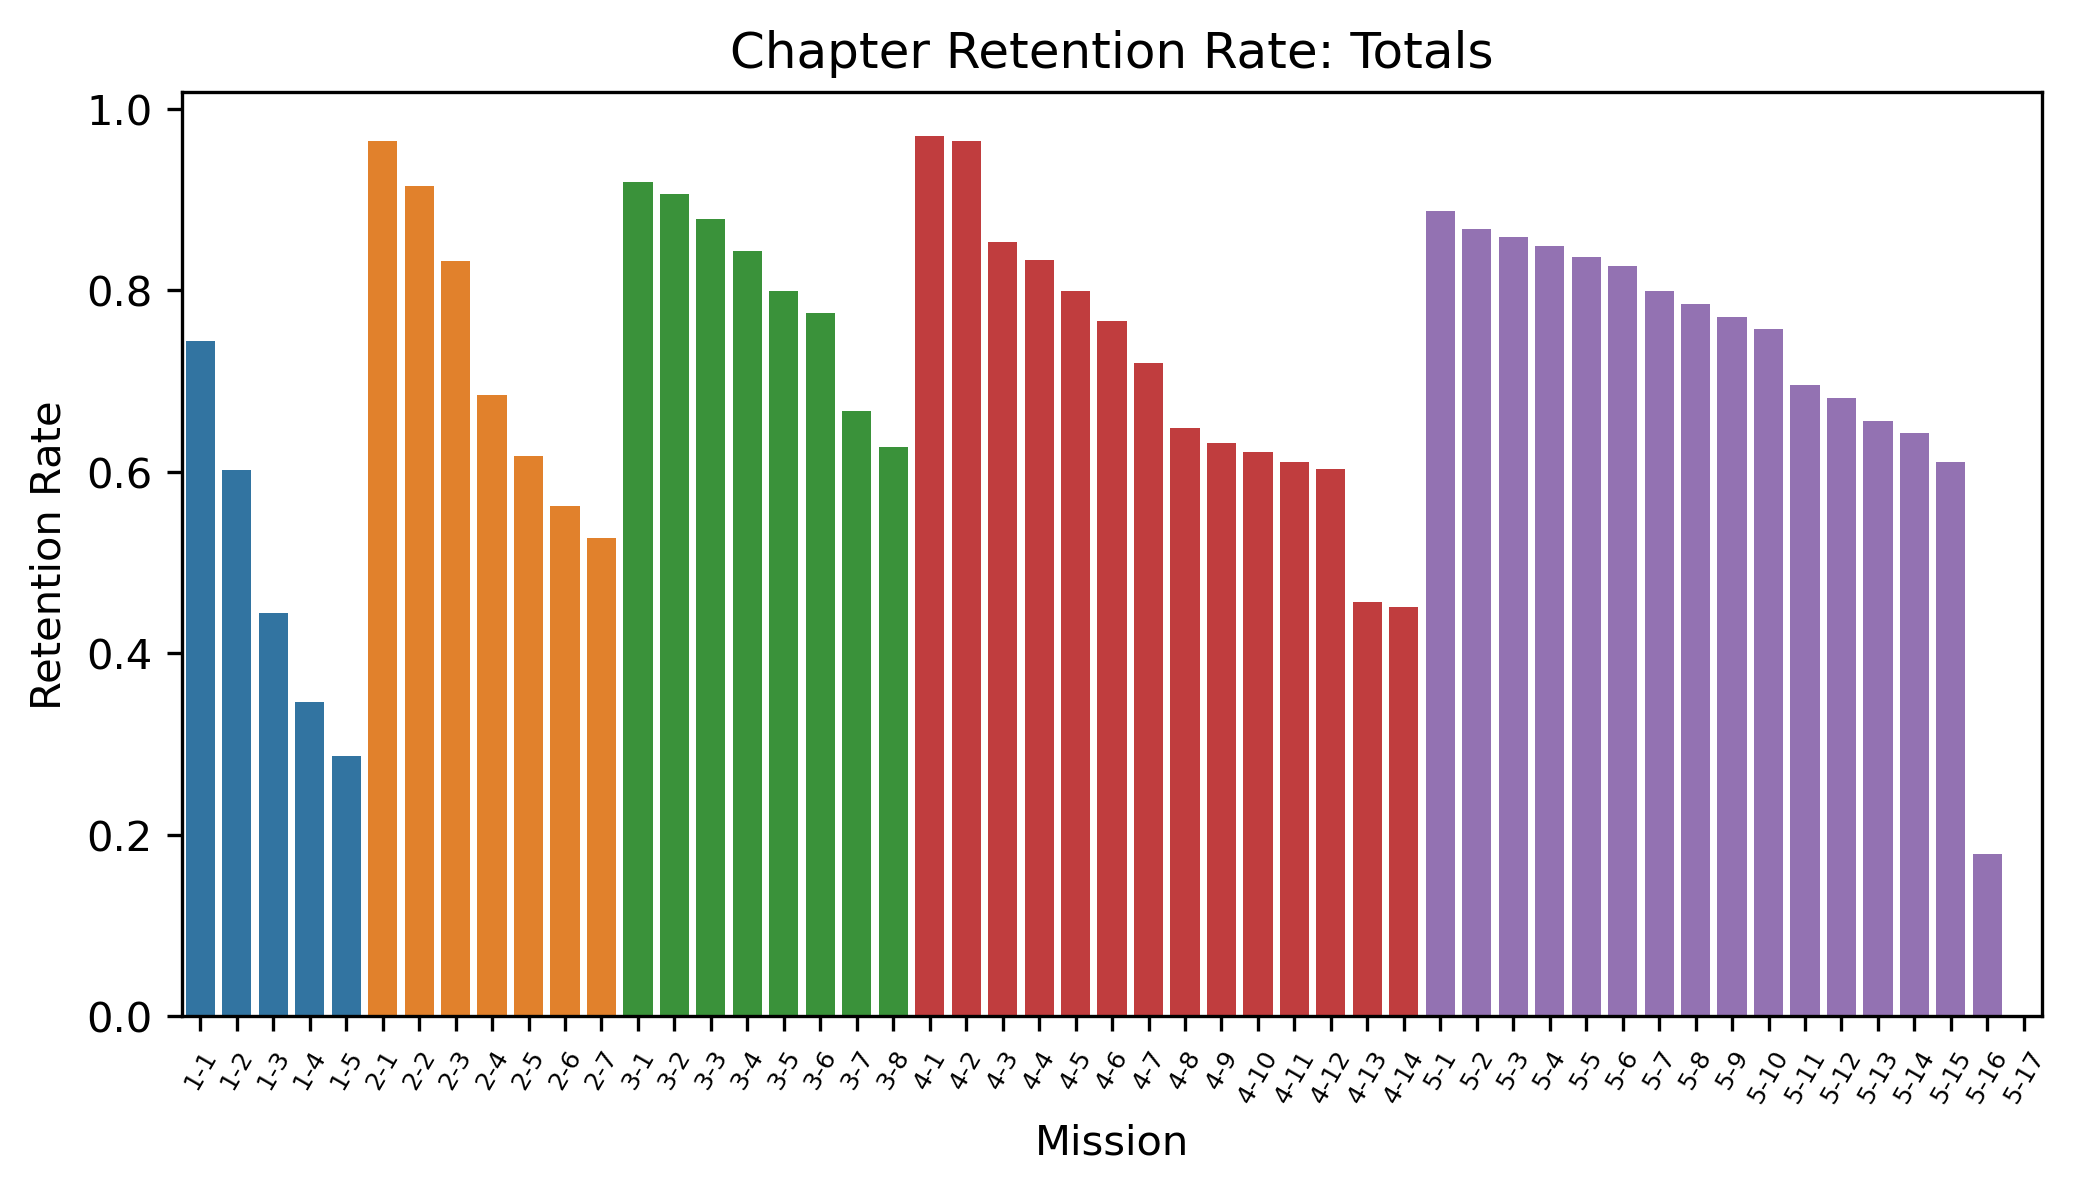
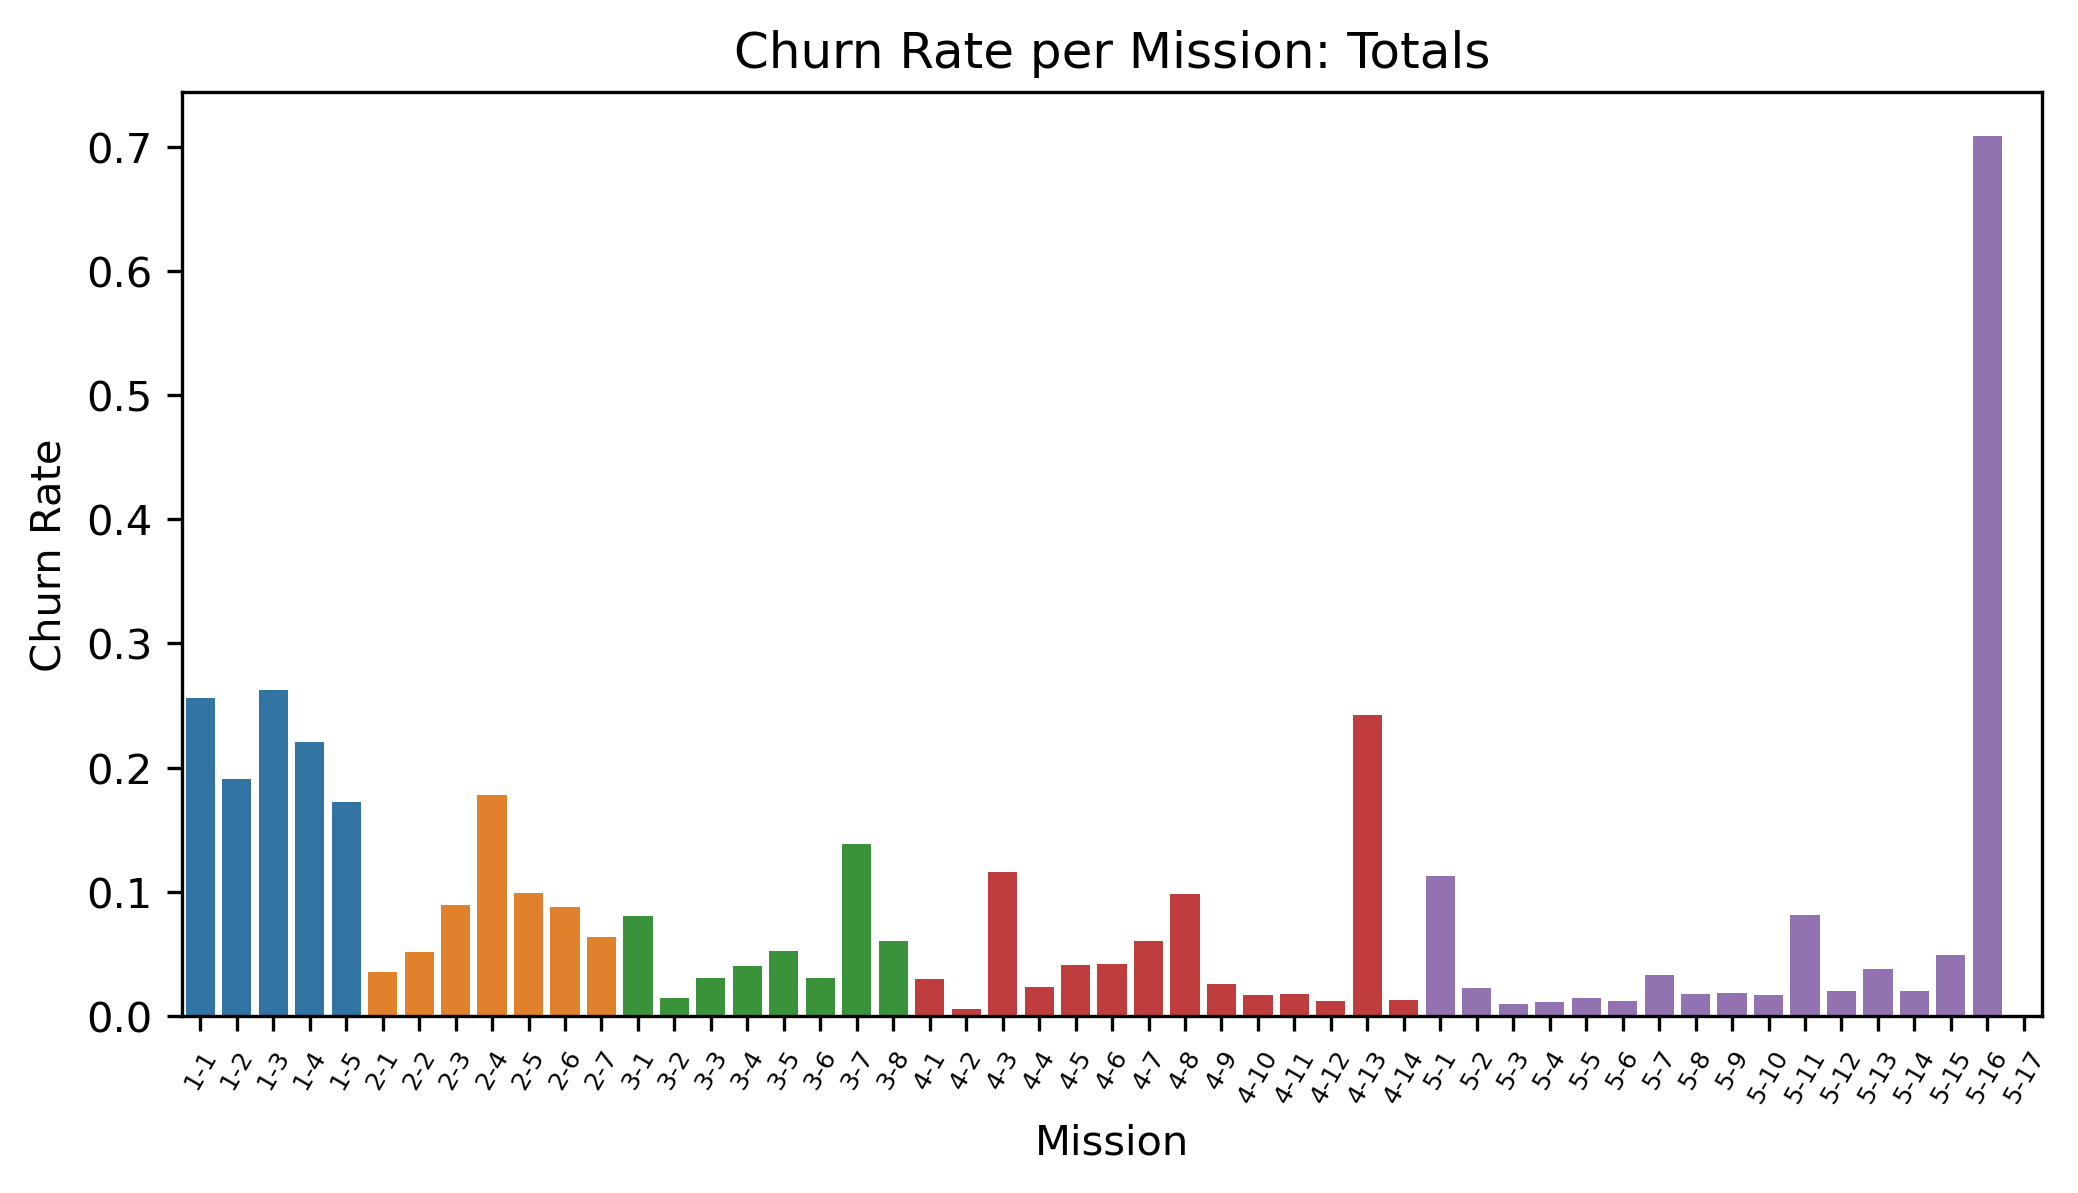
The retention funnel collapses rapidly over the course of Chapter 1, losing roughly 78% of starting players, as low-level players quickly churn from from the event. Past Chapter 1, there are several notable retention cliffs to note:
|
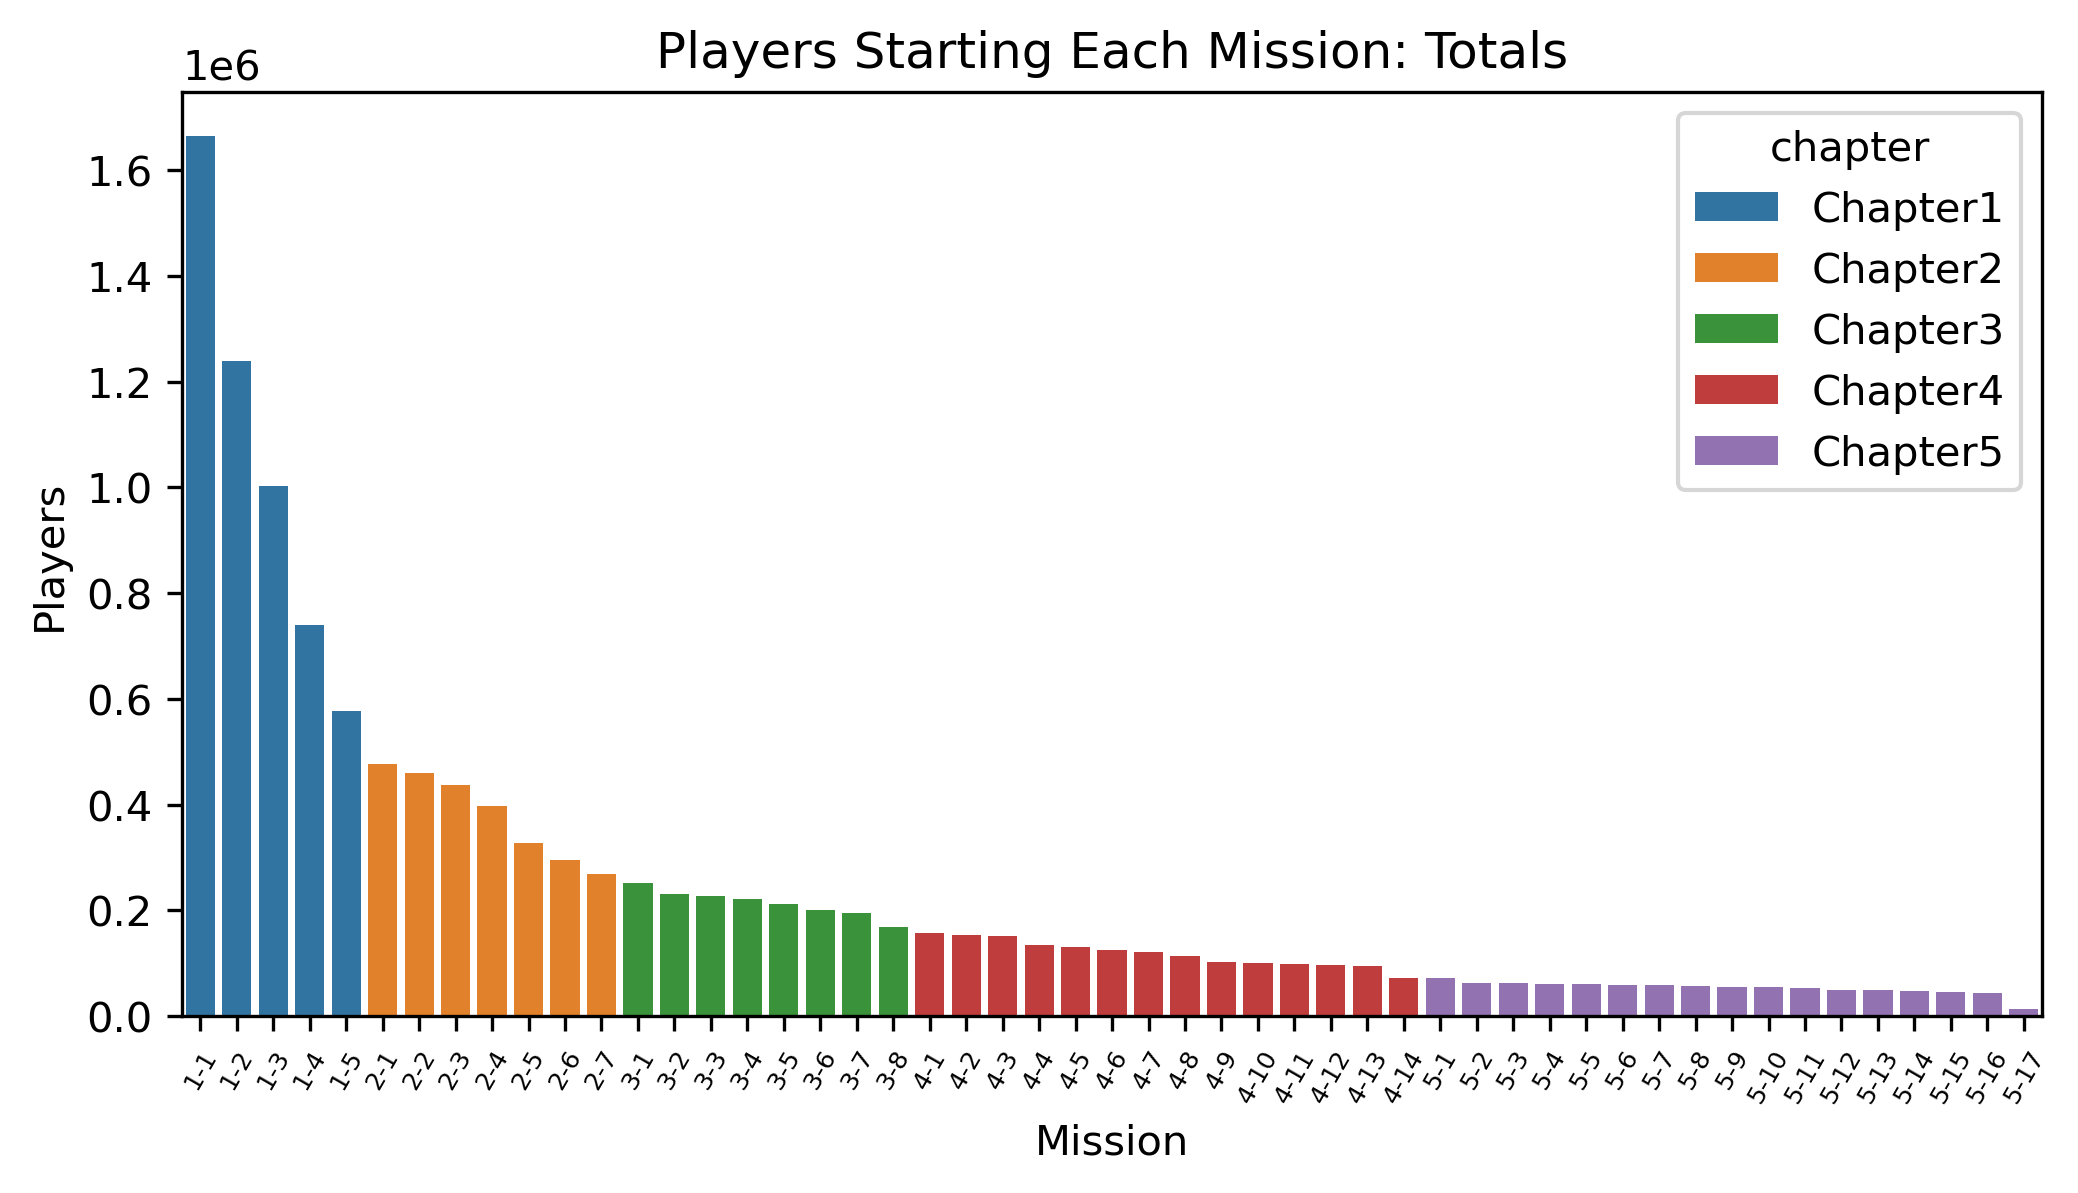  |
Chapter Retention Funnels by Player Level - Levels 1 - 20
|
|
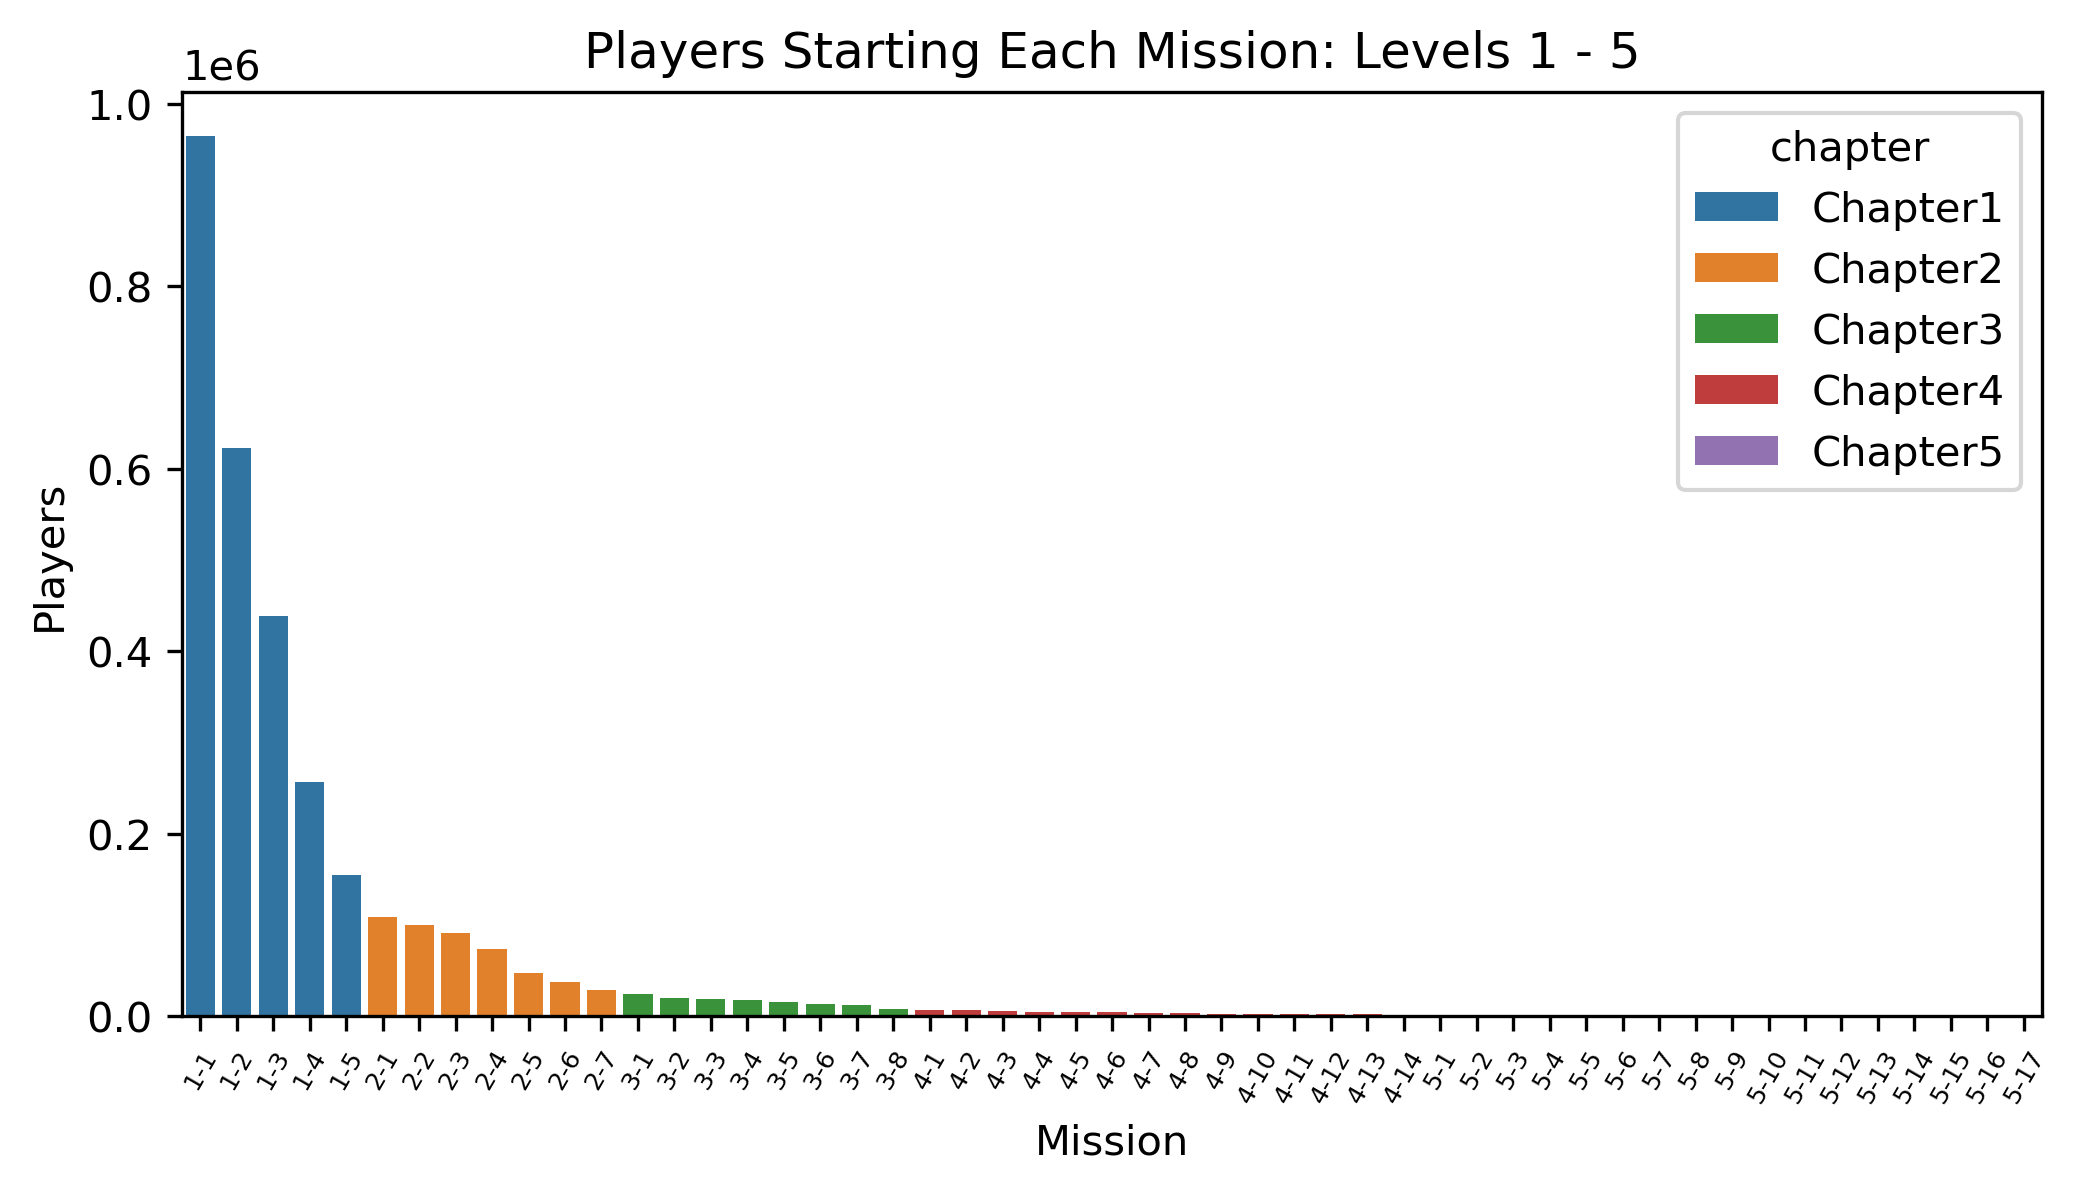
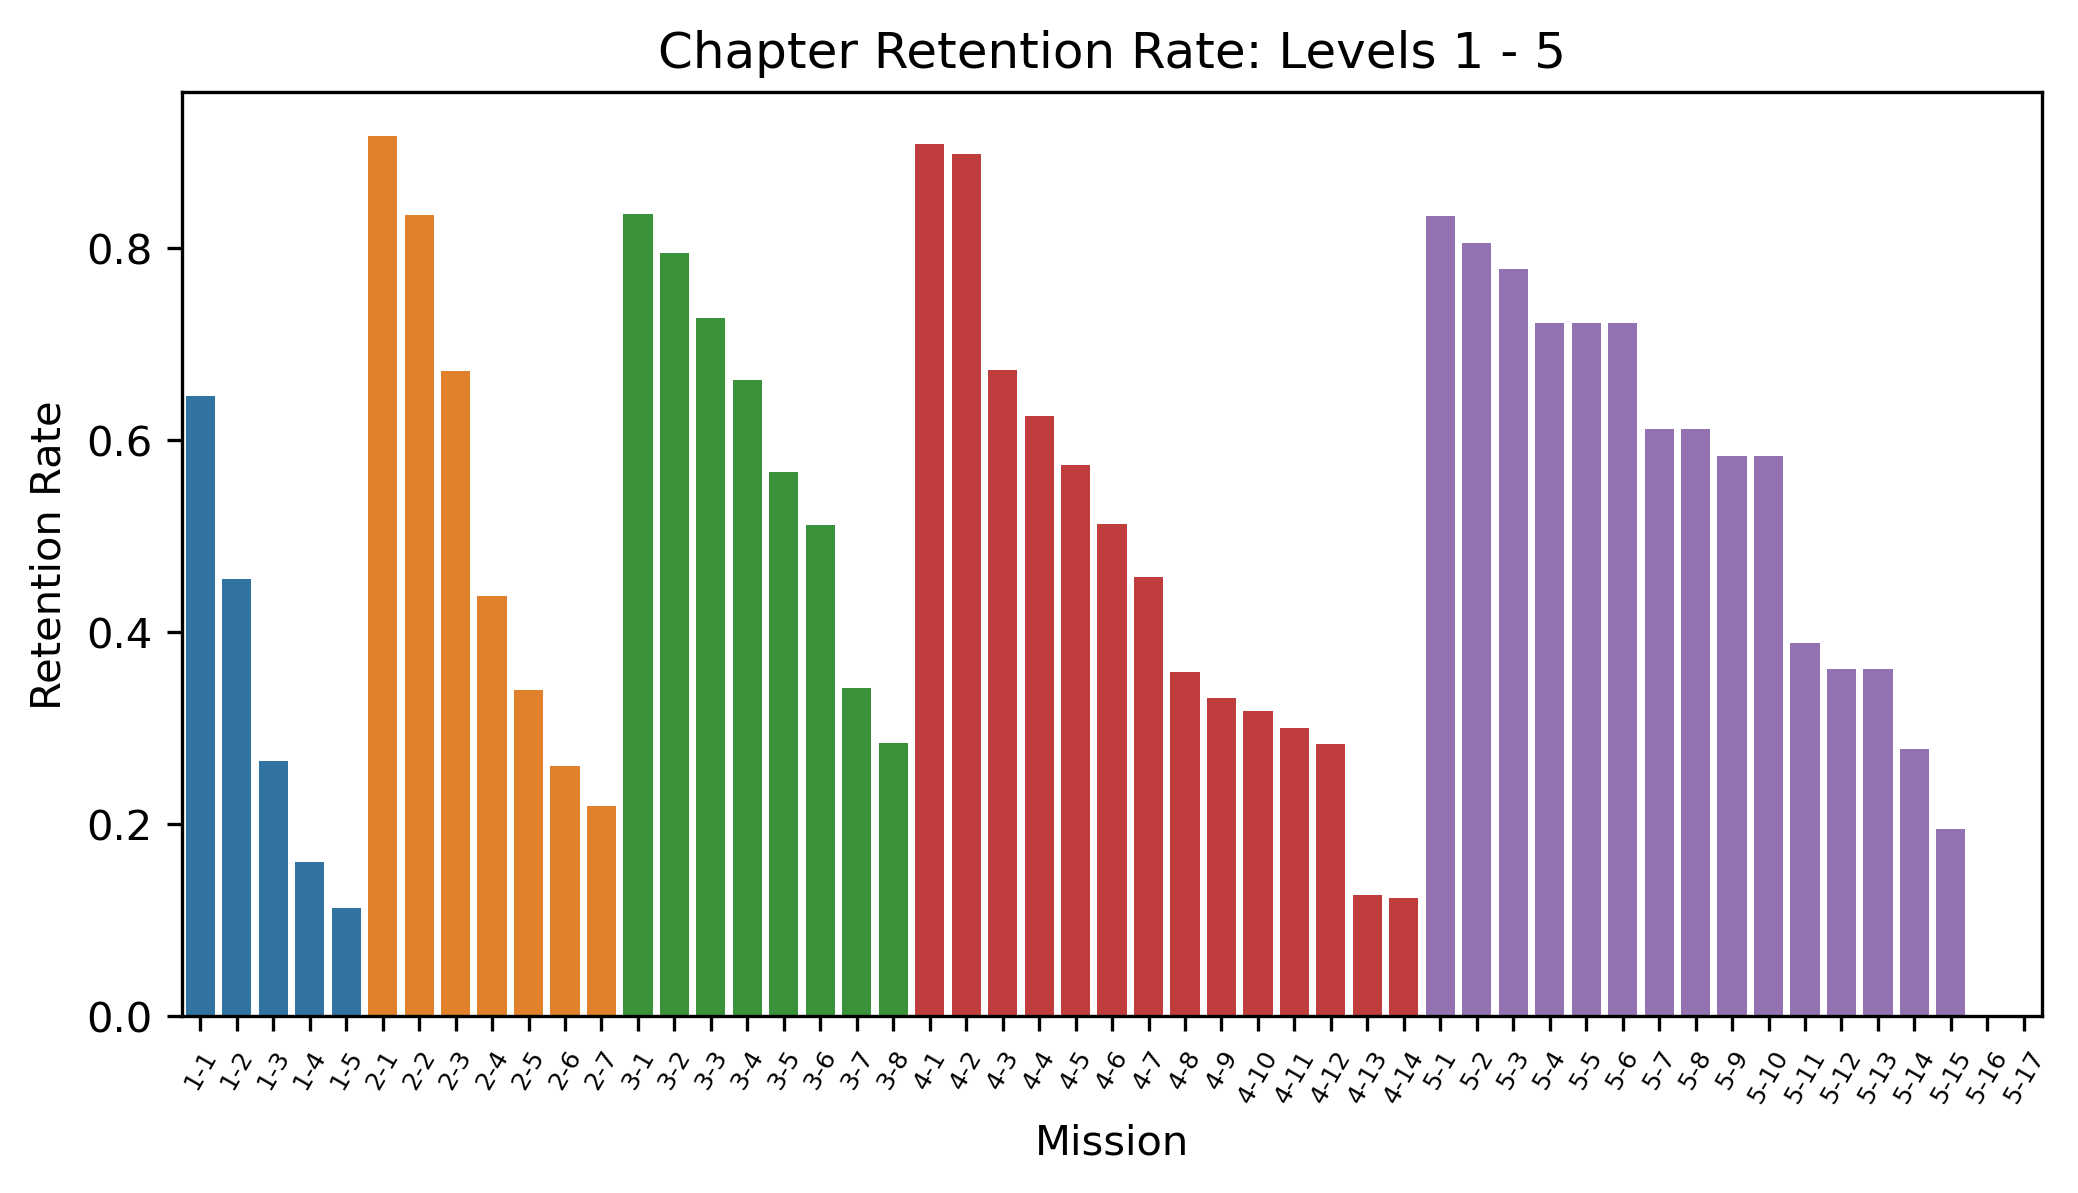
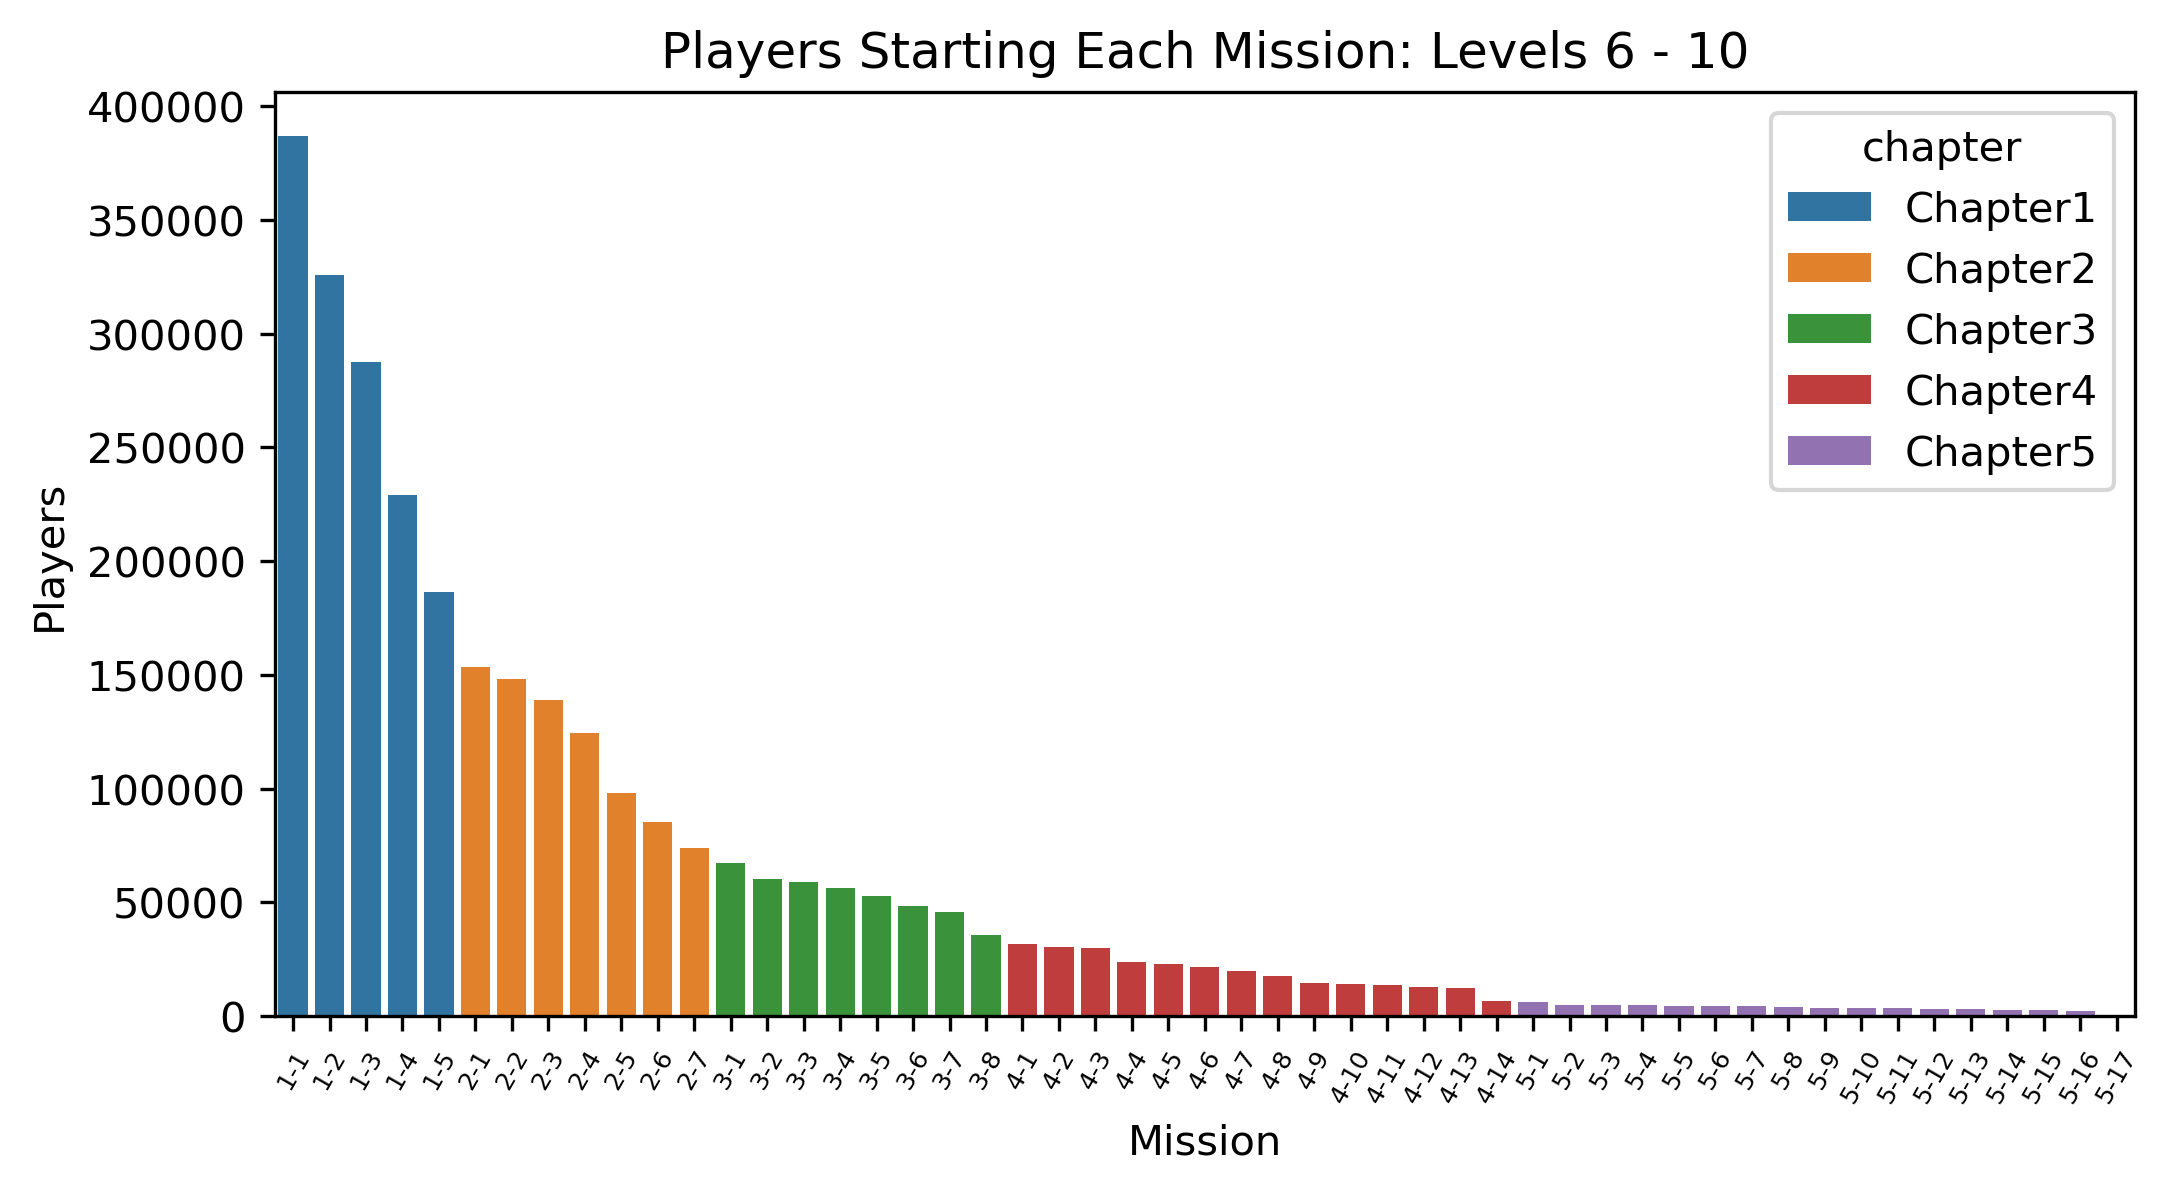
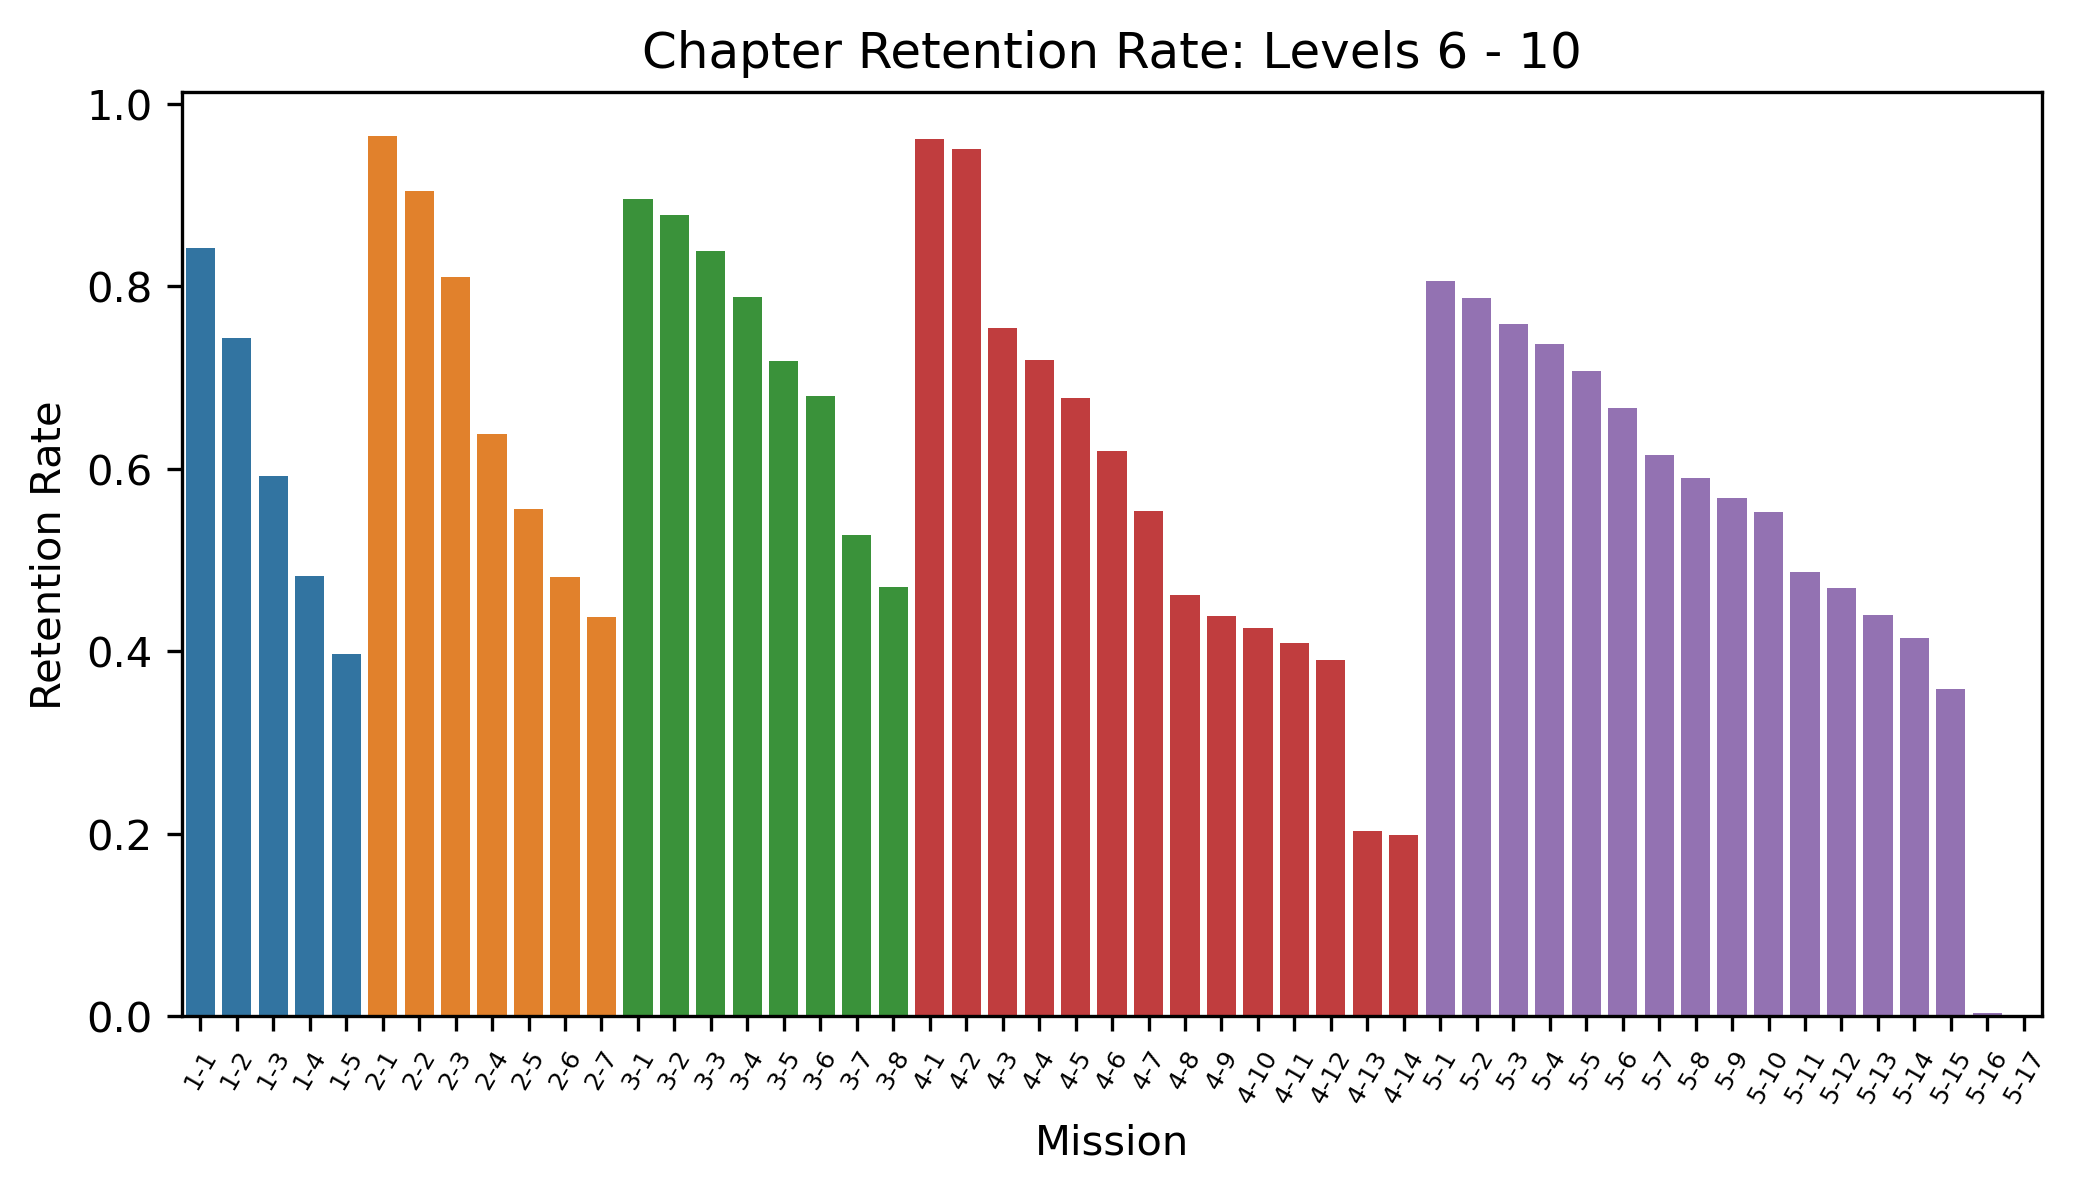
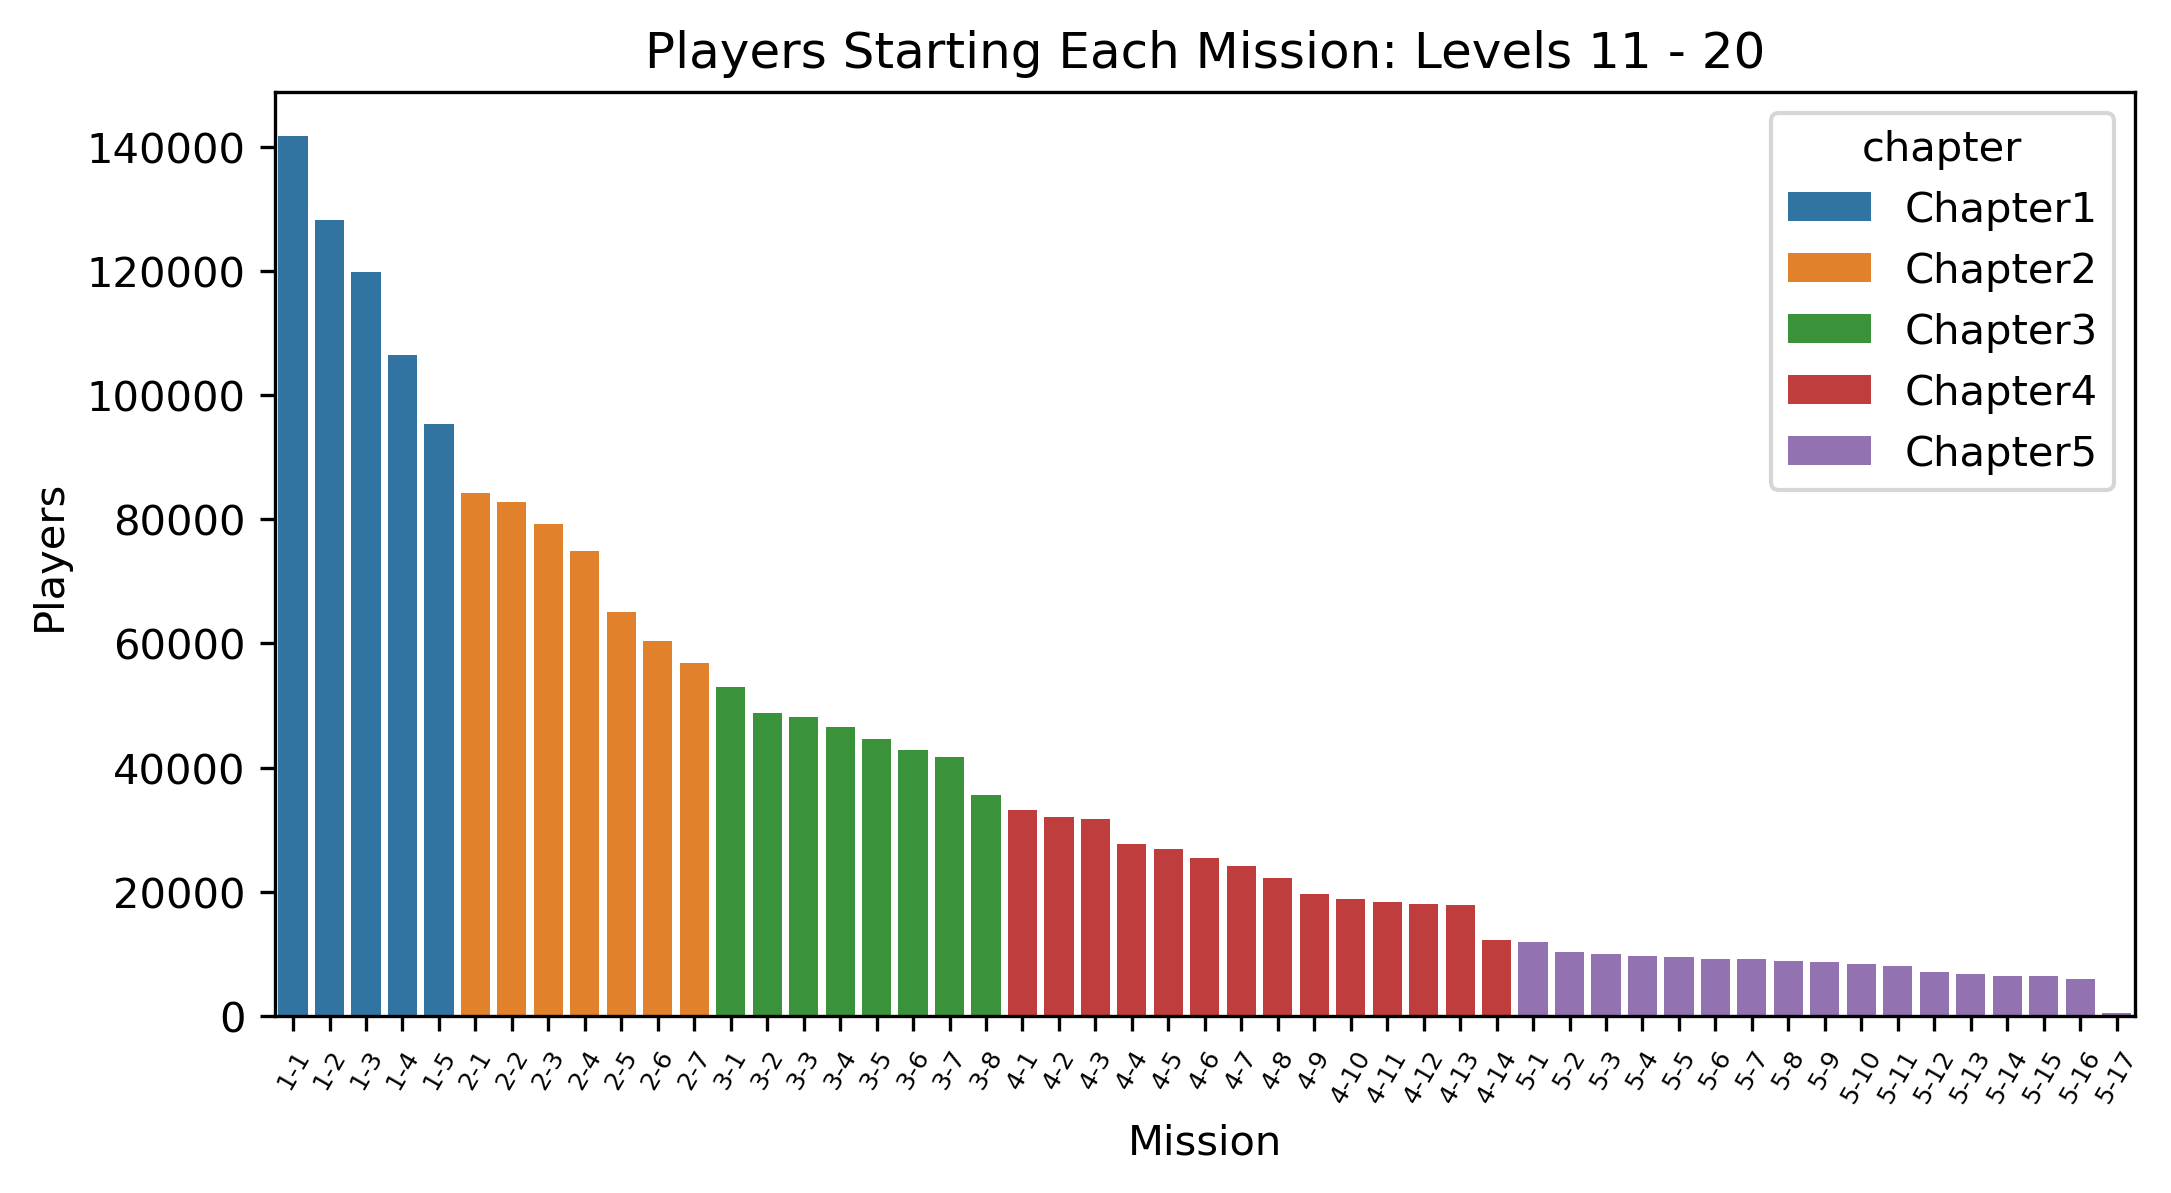
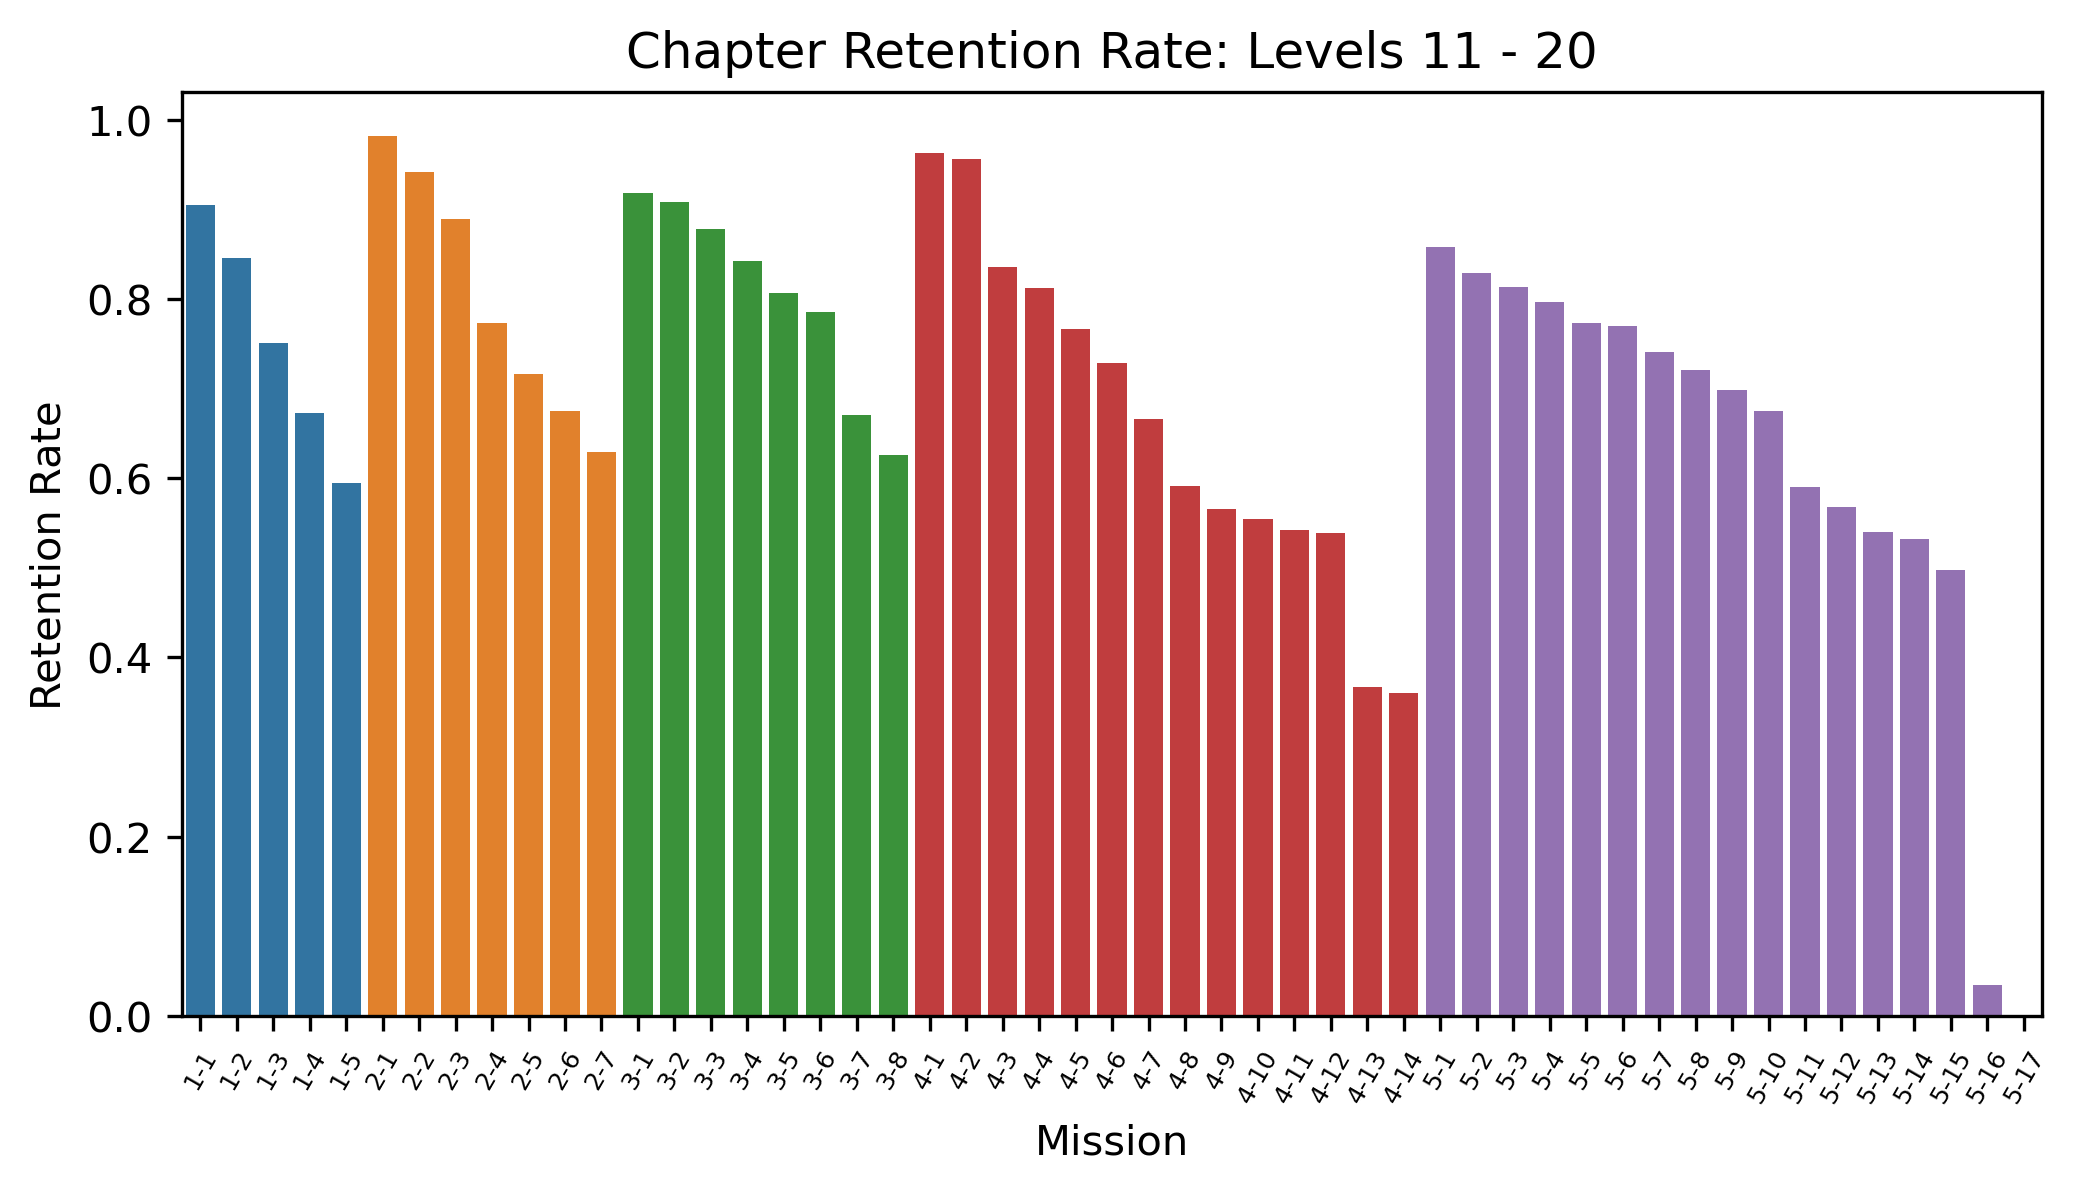
Chapter Retention Funnels by Player Level - Levels 1 - 20
|
Approximately 10% of players between Levels 1 — 5 complete Chapter 1, compared to ~40% at Levels 6 — 10, and ~60% at Levels 11 — 20. The number of users between Levels 1 — 5 that get past Chapter 3 is negligible, as is the number between Levels 6 — 10 that get beyond Chapter 4. For Levels 1 — 20, retention cliffs occur on the same missions (2-4, 3-7, 4-3, 4-8, 4-13, 5-1, 5-11, 5-16) regardless of Level or number of players. |
|
Chapter Retention Funnels by Player Level - Levels 21 - 41
|
|
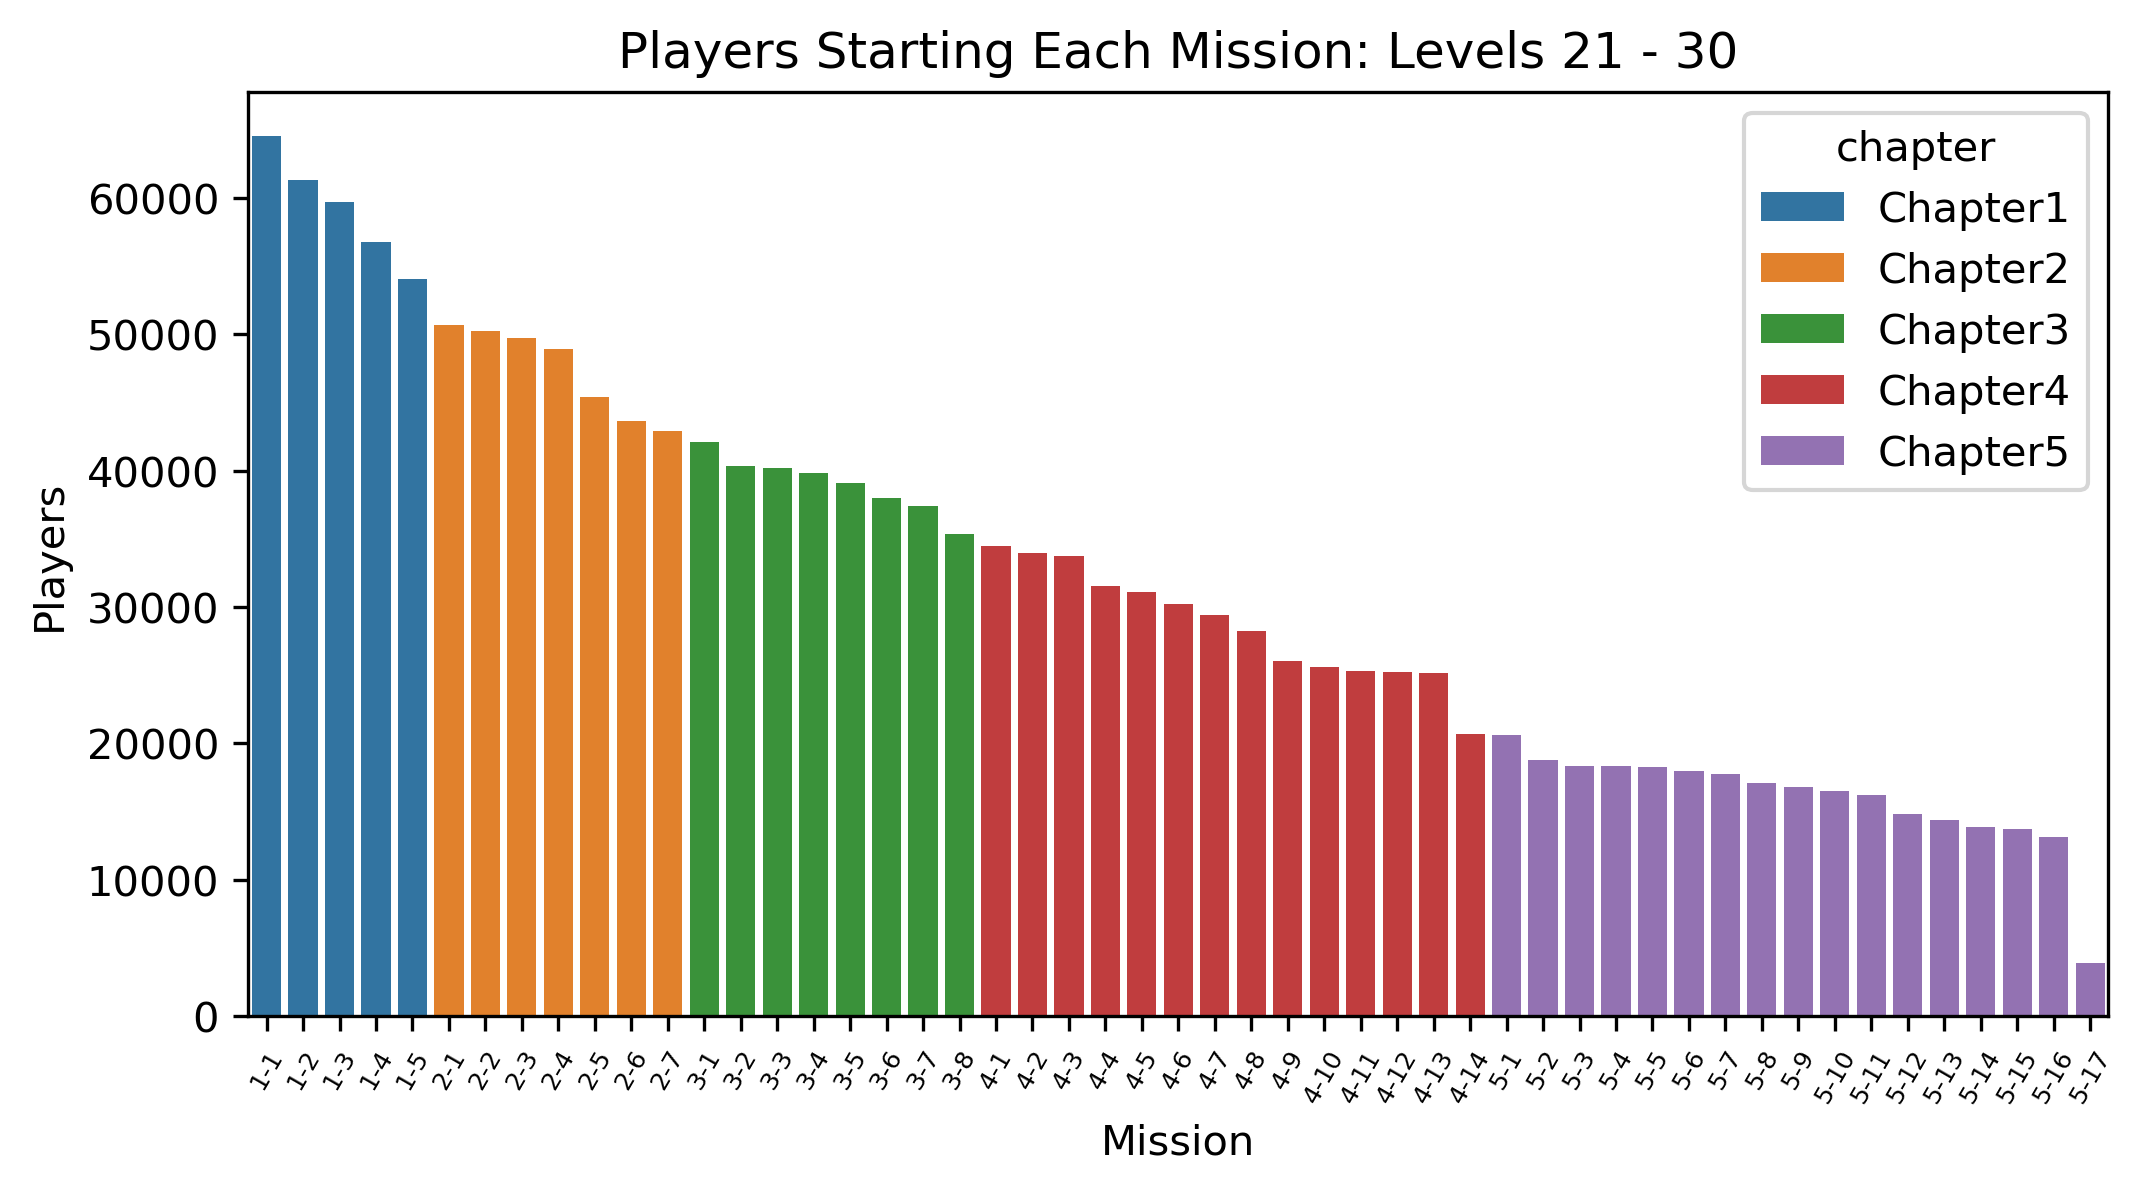
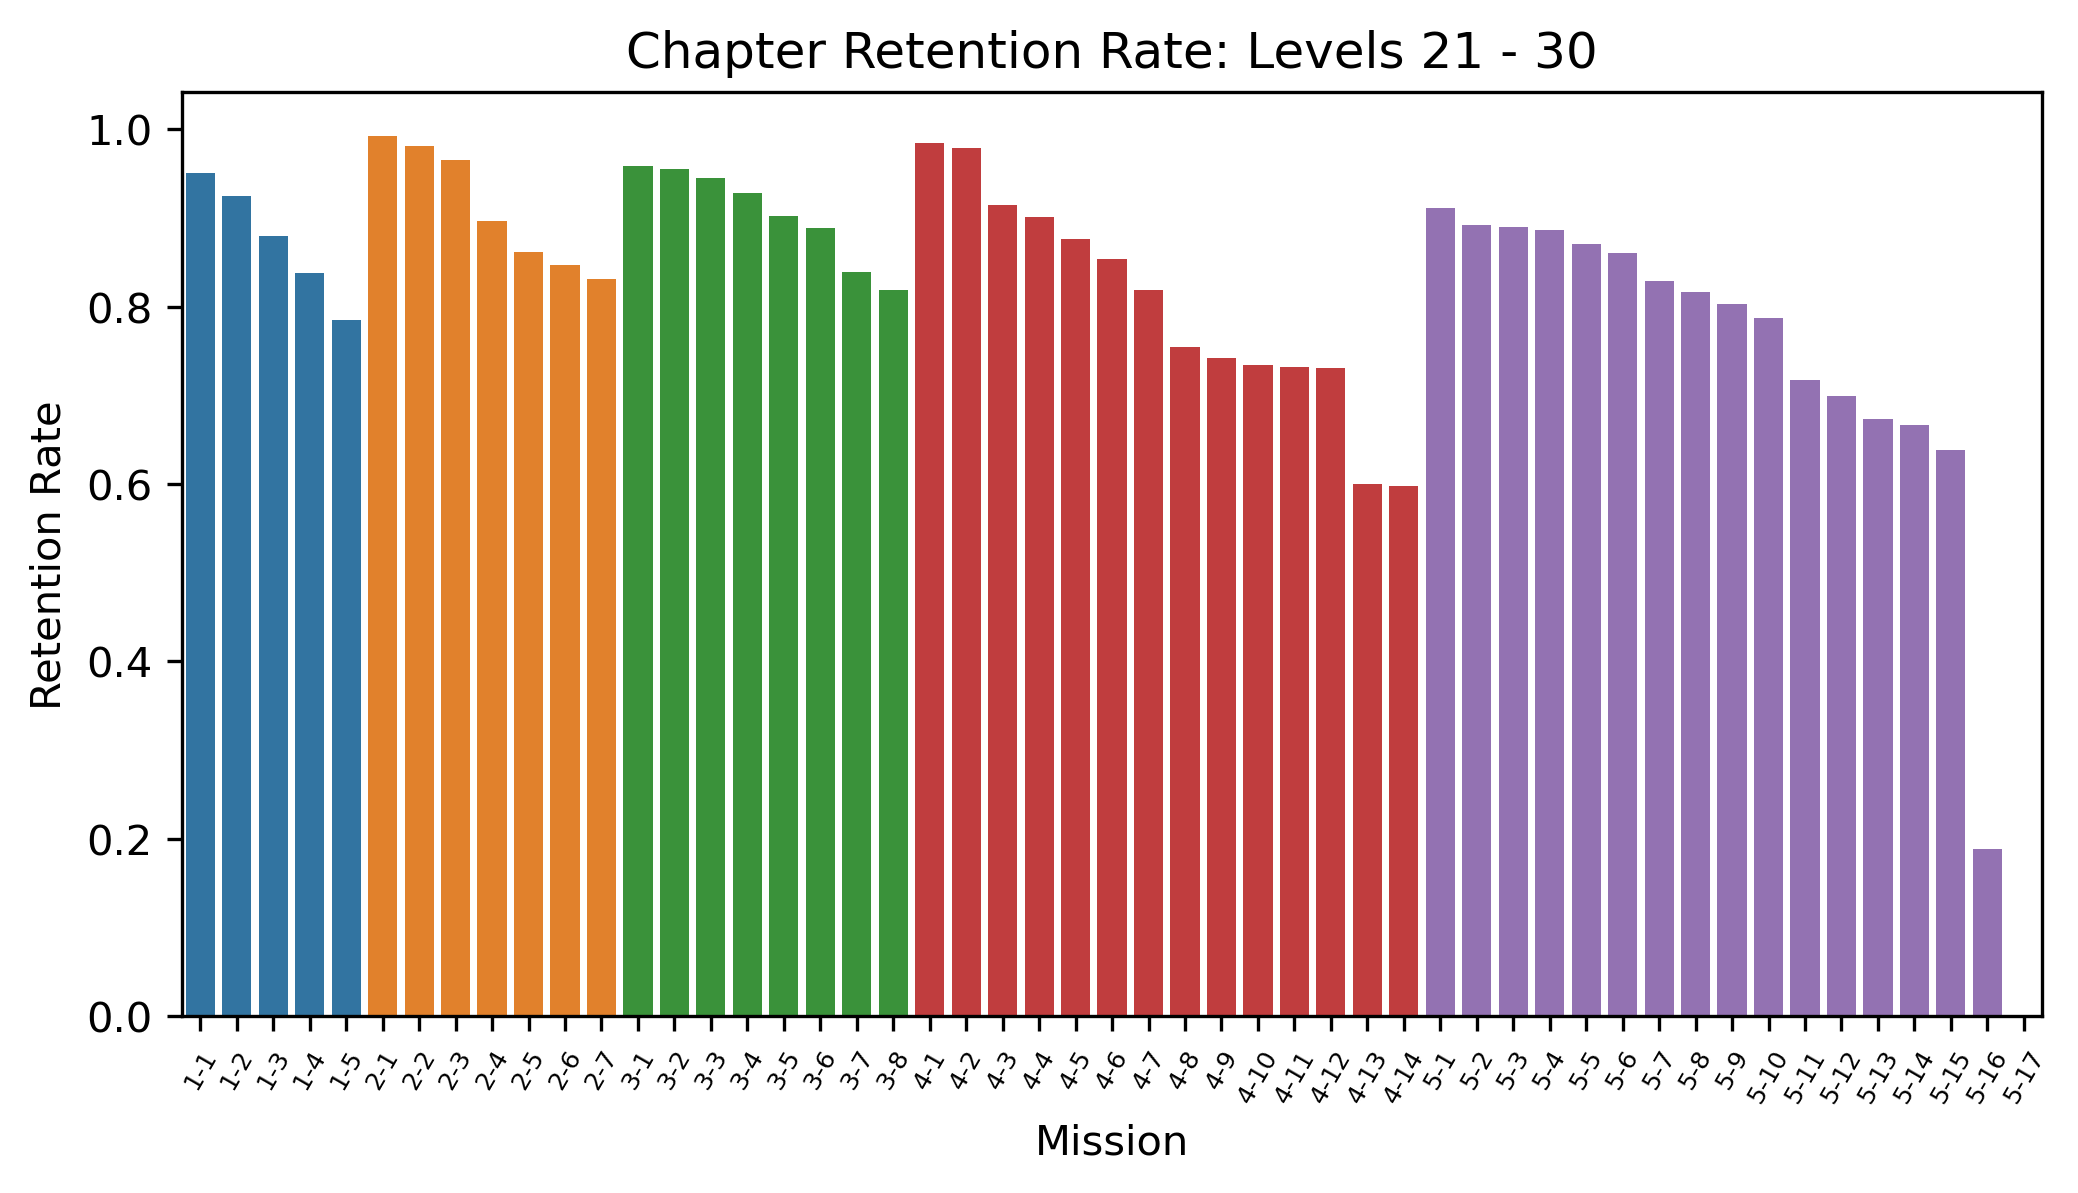
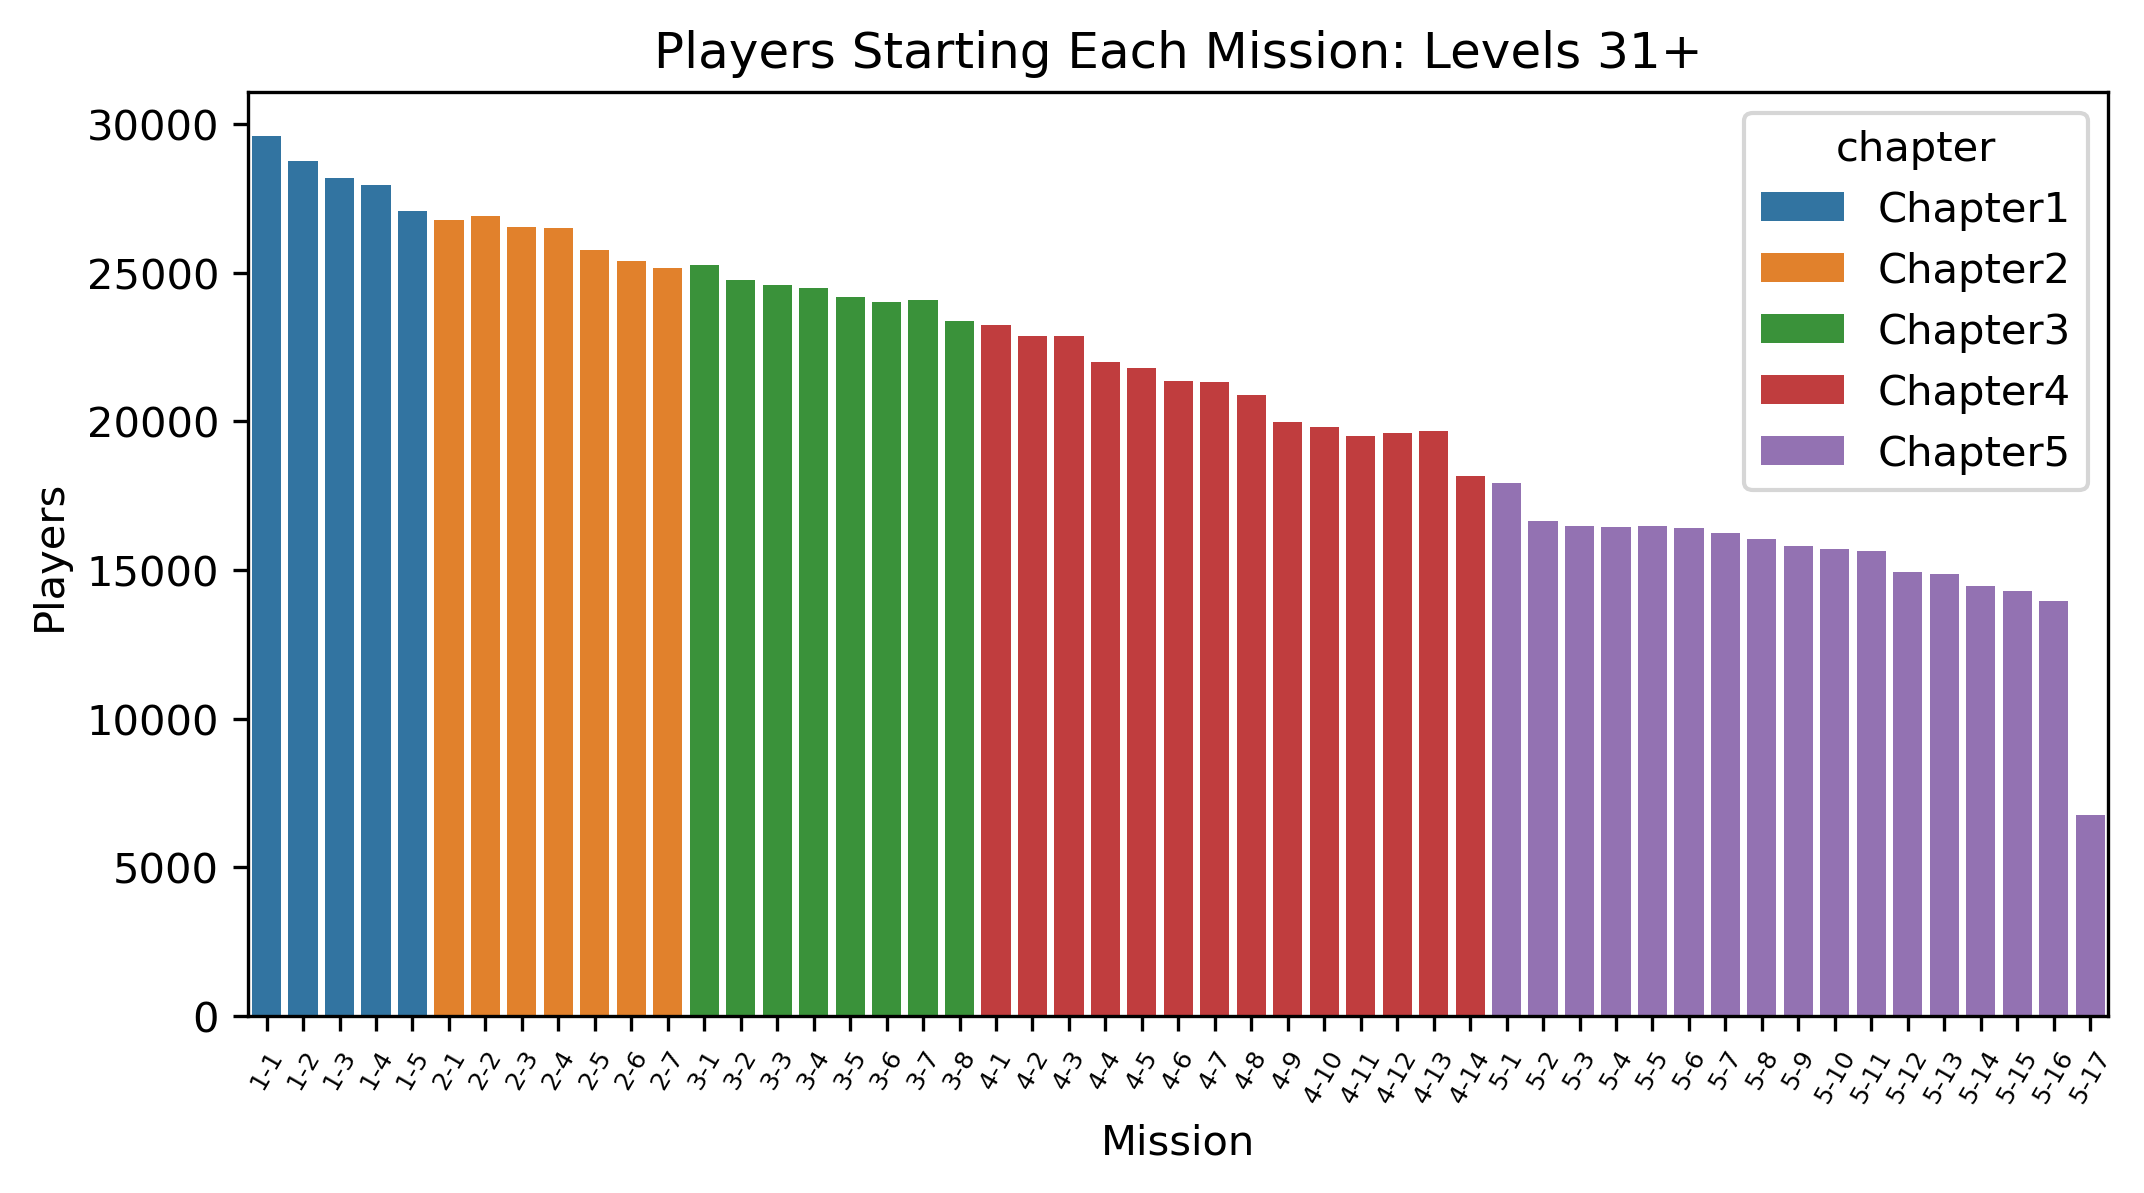
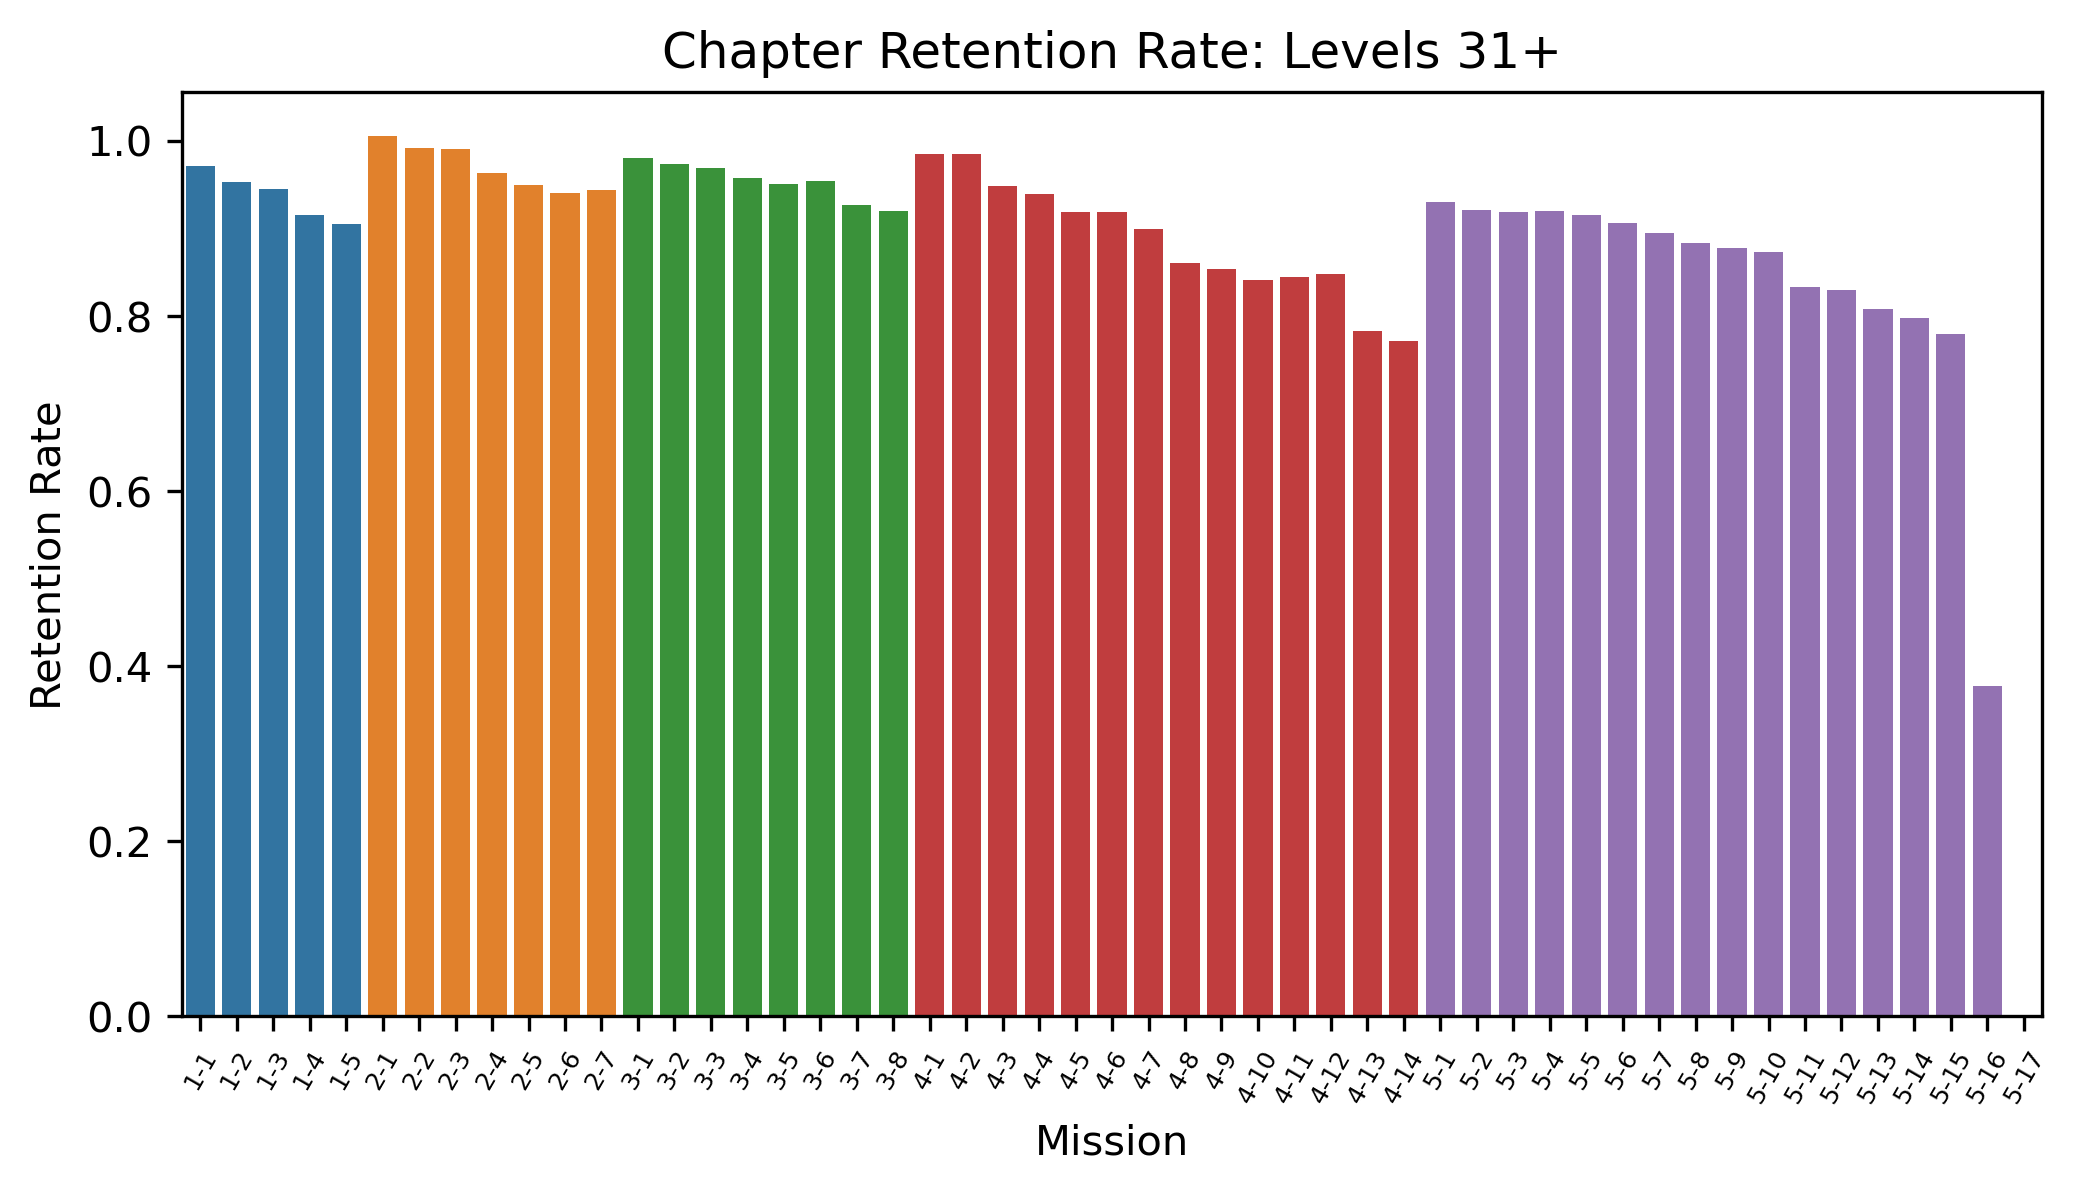
Chapter Retention Funnels by Player Level - Levels 21 - 41
|
Players in Levels 21 — 30 still show a surprising amount of churn in Chapters 1 — 3, with only about 52% of such players reaching Chapter 4. Even at Levels 31+, retention cliffs are noticeable at the same missions as seen at lower levels, suggesting that early event friction may be higher than intended. Only about 65% of Level 31+ players reach Chapter 5. Some missions at Levels 31+ show negative churn, which is believed to be due to players graduating into this level bucket from Level 30 and below. |
|
Recommendations
Reduce the Difficulty of Chapter 1
|
Of the 965,000 players in Levels 1 — 5 to start Chapter 1, only ~65% clear the first mission, and only ~28% (~270,000) get past Mission 1-3. Meanwhile, Mission 1-4 has the highest skip rate, at ~5% of Level 1 — 5 players who reached it. Reducing the difficulty of Chapter 1 — and particularly of missions 1-1 — 1-3 — will allow more players to reach the missions driving revenue, i.e. 1-4 and 1-5. The difficulty tuning of 1-4 and 1-5, as well as the chapter rewards, should also be looked at, since nearly 2x as many players are paying to skip the penultimate mission than the finale. Either 1-5 is significantly less difficult than 1-4, or the rewards for completing 1-5 are not worth paying for. |
  |
Retool Missions 2-5, 2-6, & 3-2
|
Missions 2-5, 2-6, and 3-2 have unusual spikes in the skip-to-churn ratio. These missions have high skip rates while having usual-to-low churn rates compared to their neighbours, which may be an indication that these levels are boring or frustrating, rather than challenging-but-engaging. The spikes at 2-6 and 3-2 are seen into Levels 21+, which heavily suggest that these levels are not being skipped merely for their difficulty.
|
  |
Rebalance the Ratio Between Chapter Mission and Finale Skip Costs
|
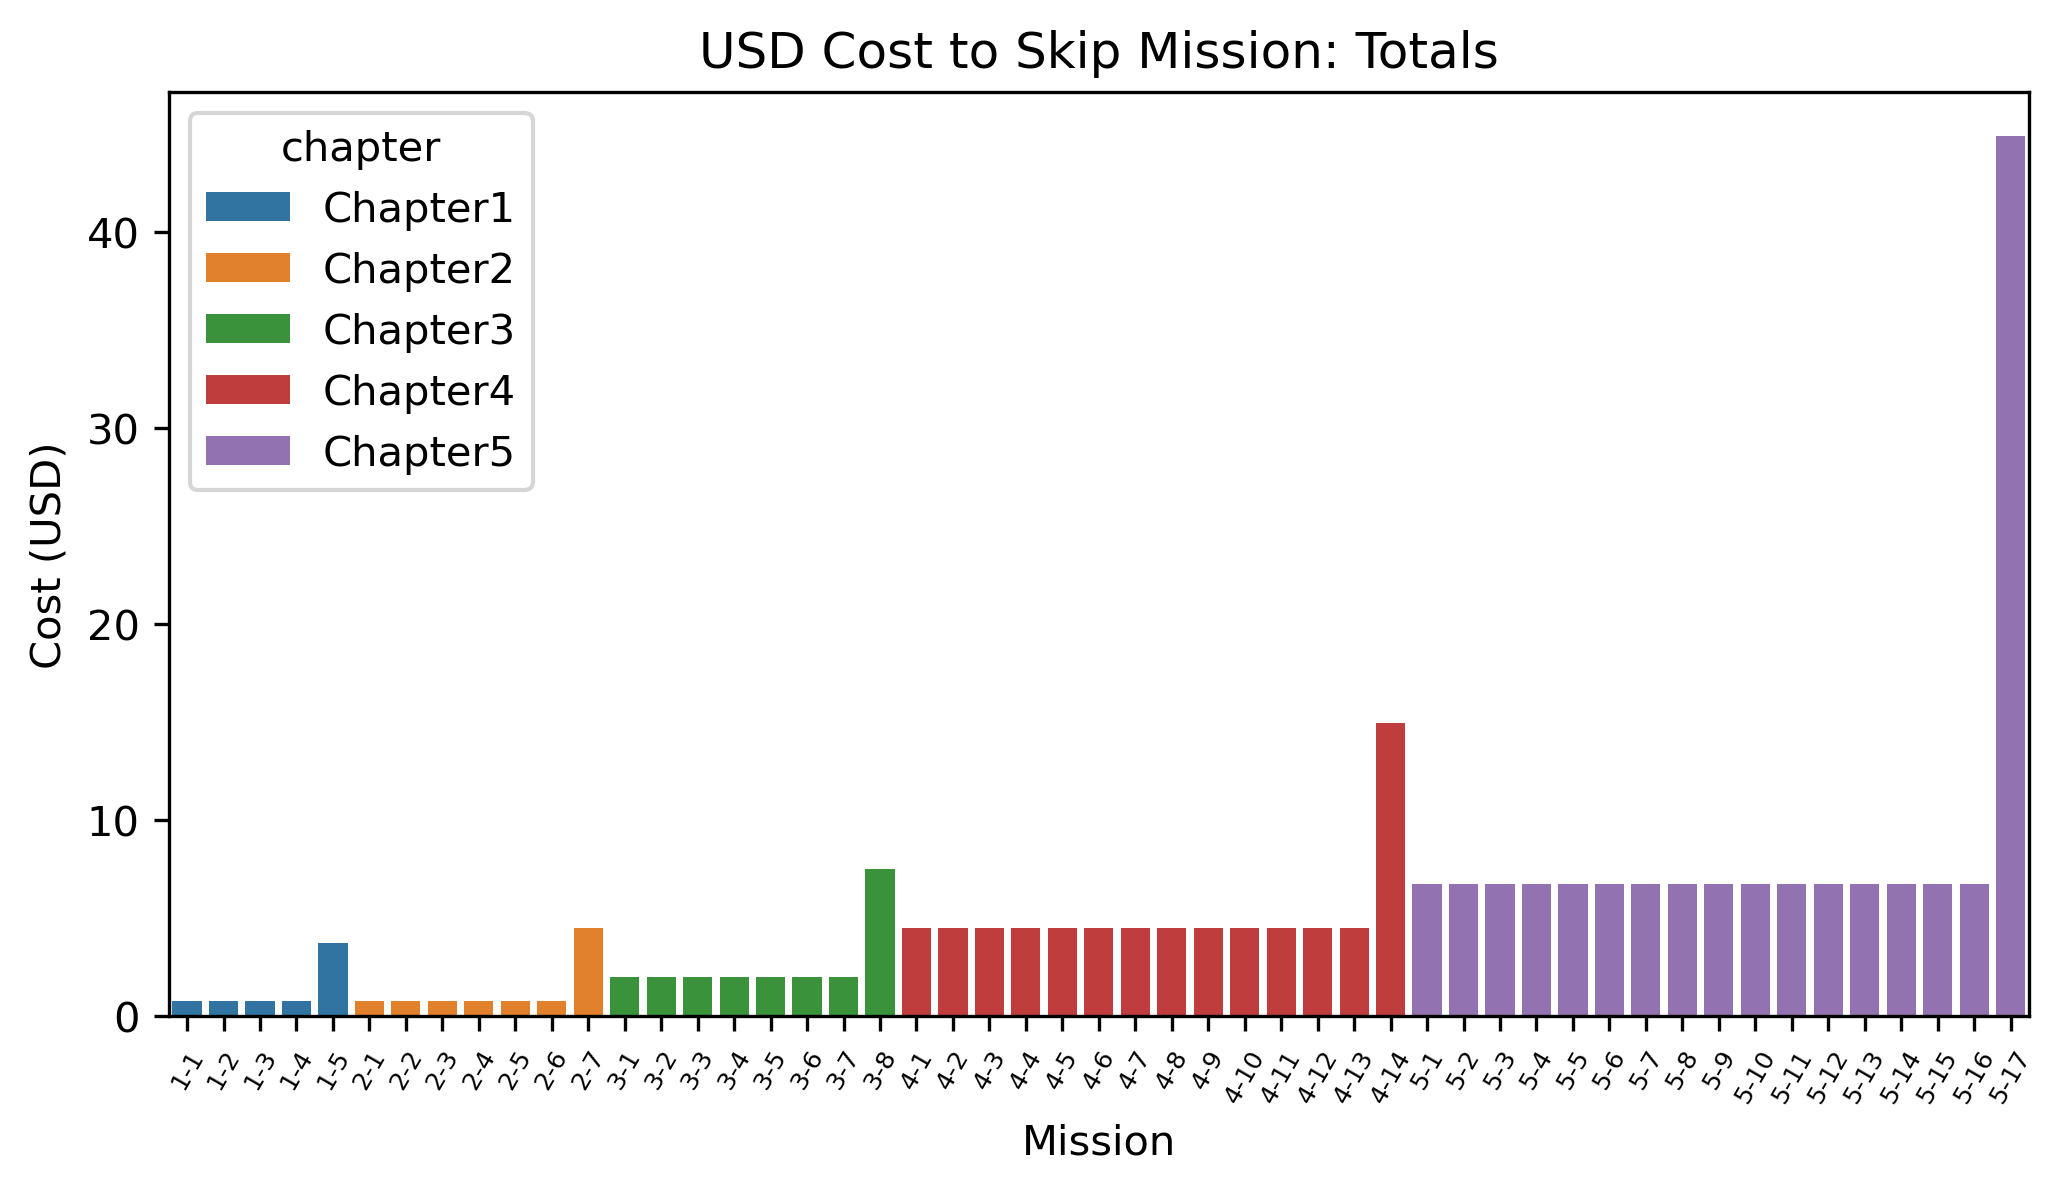
The ratio between skip costs for chapter finales (e.g. 1-5) and non-finales (e.g. 1-1 — 1-4) is inconsistent and fails to follow any kind of pattern.
Meanwhile, the skip rates for early chapter finales falls well behind the skip rates for non-finales, while in later chapters very little is spent on skipping regualr missions. This may suggest players do not see value in early chapter rewards, while they feel it necessary to save up for late chapter finales. |
  |
Lower Late Game Skip Costs
|
The cost scaling for skipping missions is very aggressive, particularly in later chapters. The cost to skip the Chapter 4 finale is nearly $15, while skipping the event finale is almost $45.
|
|
Retune Difficulty in the Late Game
|
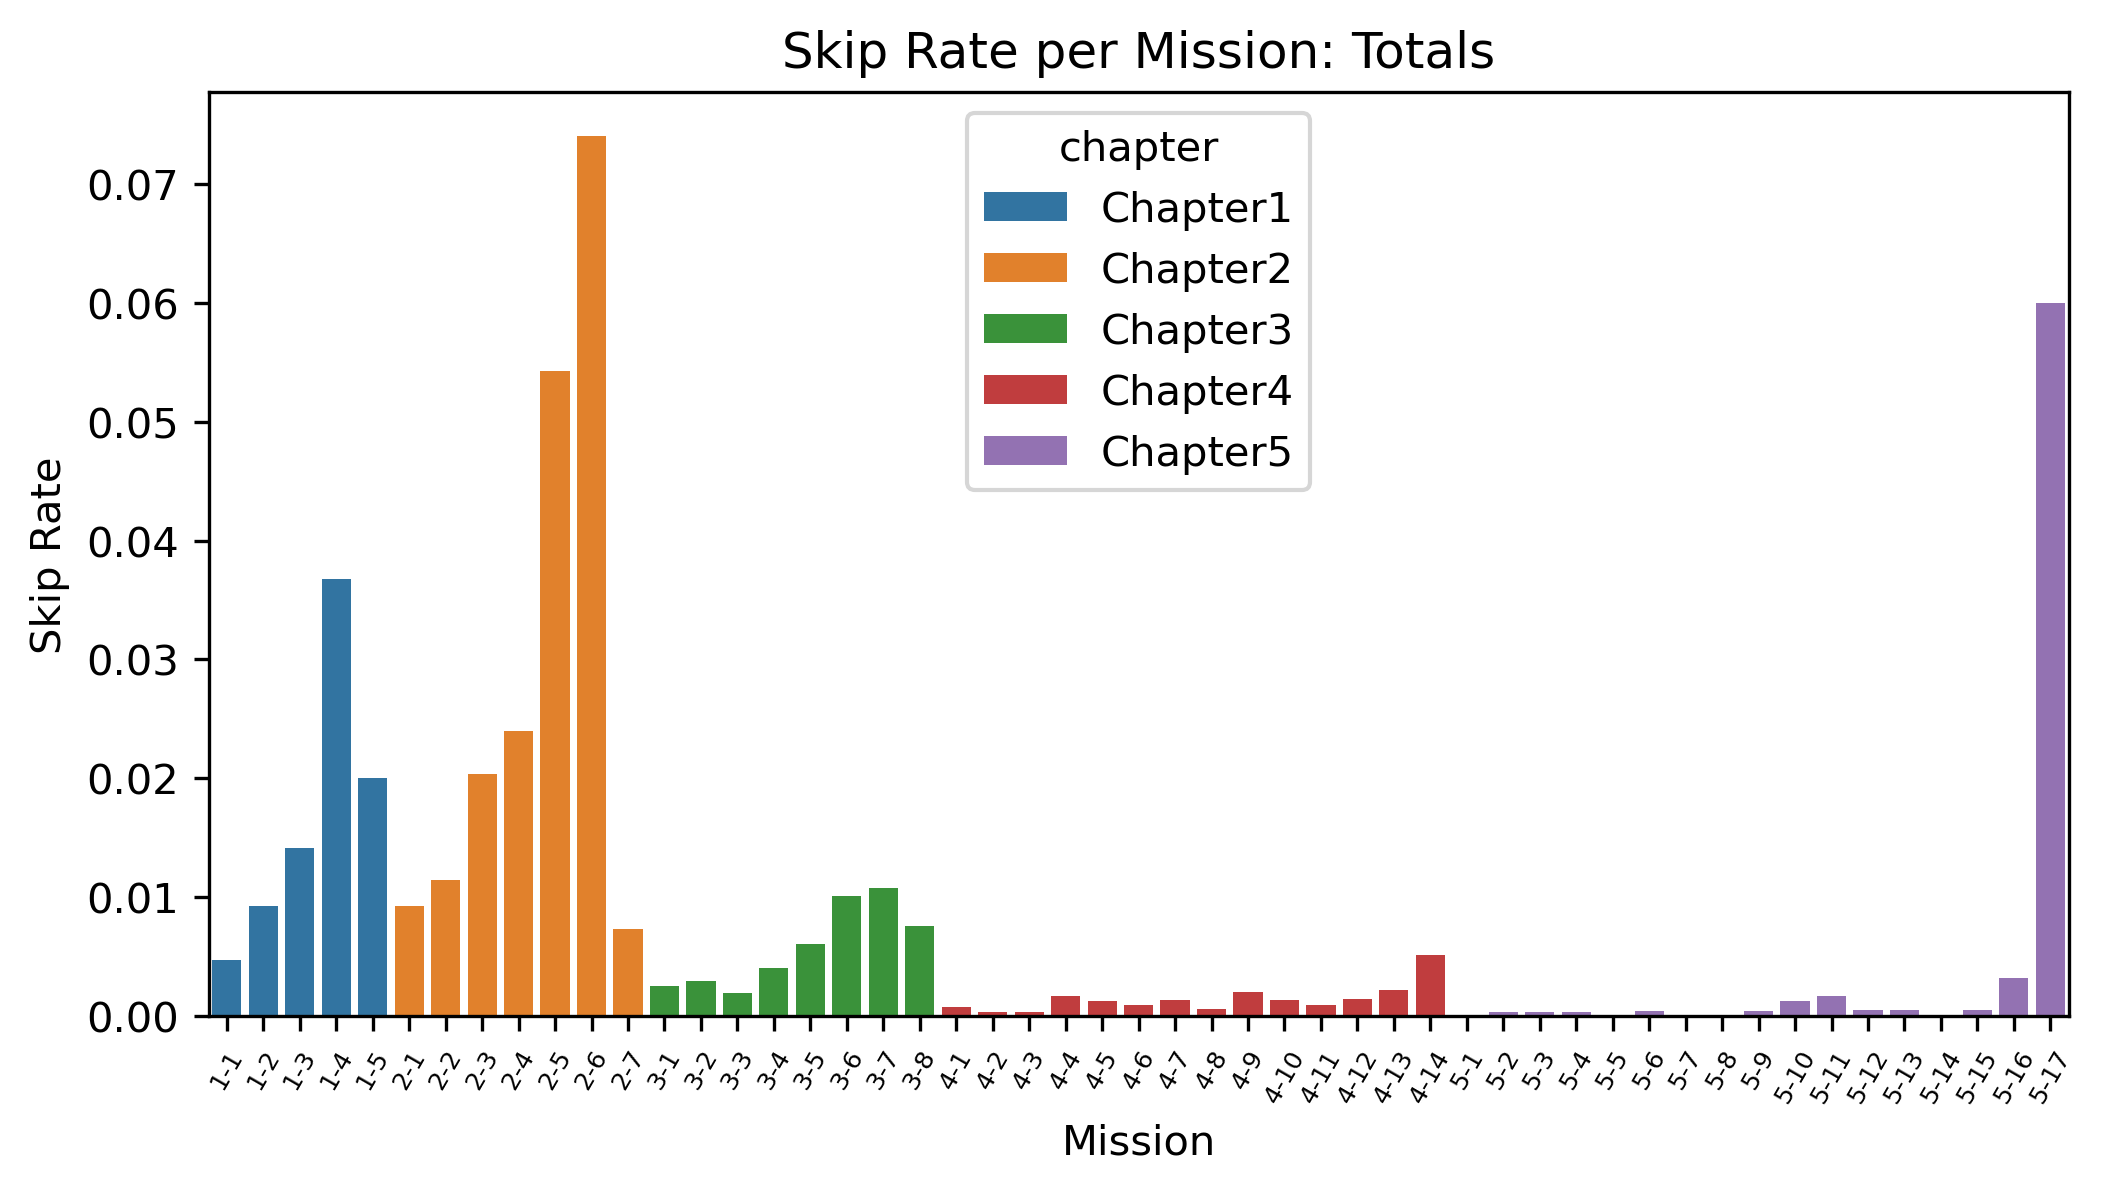
There are clear signs of a sawtooth difficulty curve in the first 3 chapters, with the mission skip rate increasing level-over-level (for the most part). This pattern completely collapses in Chapters 4 and 5, with the bulk of late game spending being on Mission 5-17, the event finale. Chapters 4 and 5 are both long enough to contain multiple difficulty waves with mid-chapter sub-climaxes, which could generate more spending and more engagement as players work towards the event’s final rewards.
|
|
Retune Difficulty in Early Chapter Finales
|
Chapters 1 — 3 illustrate a recurring pattern in mission skip rates: Skip rates increase (mostly) monotonically until the penultimate mission, and then decrease or collapse for the chapter’s conclusion. At the same time, churn rates also fall for the chapter finales. This suggests that the early game chapter finales may not be challenging enough for players, and may even be anti-climactic after facing missions that generated significant spikes in skip rates. We should explore increasing the difficulty of Missions 1-5, 2-7, and 3-8 (and 4-14, as the incrase in spending there is still quite small), and possibly decreasing the challenge of the penultimate chapter missions.
|
|